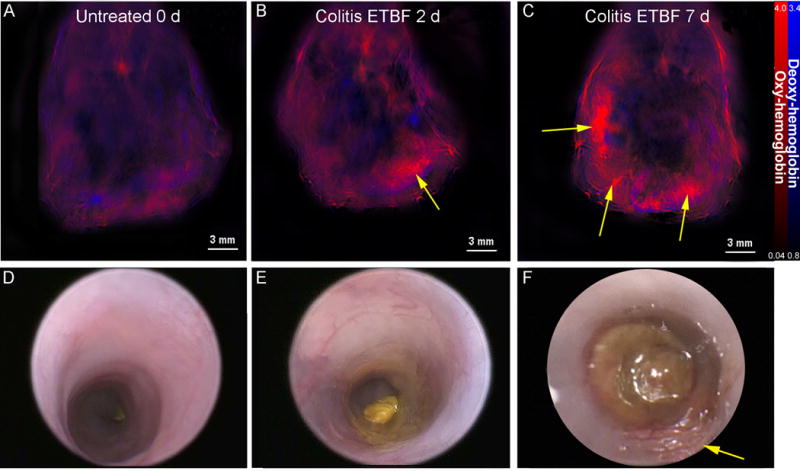
Figure 1. Multispectral Optoacoustic Tomography Depicts Inflammatory Changes in Murine Colitis.

Wild-type C57B/6 mice were orally inoculated with either PBS alone (control) or ETBF. (A) depicts MSOT imaging of mice prior to ETBF treatment (untreated), while (B) and (C) represent images of mice 2 days and 7 days, respectively, after bacterial inoculation. Arrows indicate concentrated areas of oxy-hemoglobin corresponding to colitis (B–C). Findings on MSOT were compared to colonoscopic findings (D–F) for each group of mice. Arrow indicates an area of inflammation indicative of colitis (F).
