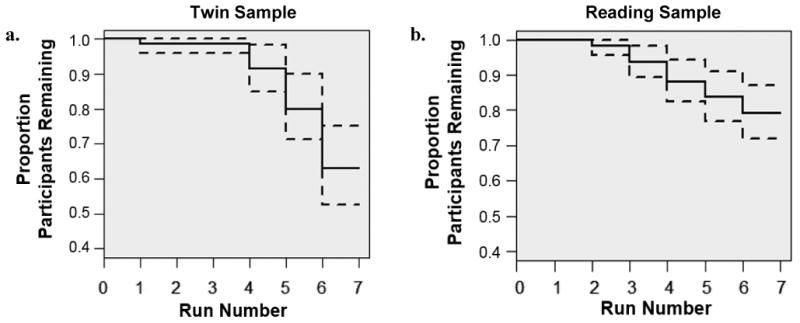
Figure 2. Survival curves for continued participation across the first scan session.

Note. Proportion of participants providing data for each run in the twin (2a) and reading (2b) samples at the first visit. Dotted lines represent 95% confidence intervals.
