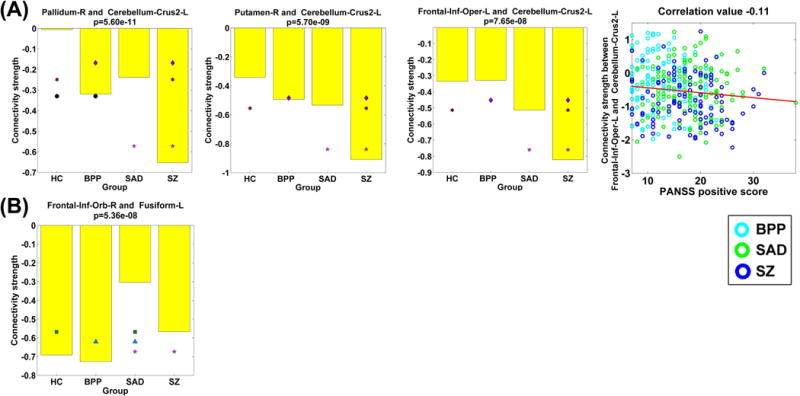
Fig. 12.

(A) Statistical analyses results of three FCs that showed significant group differences between the SZ group and the other three groups, tested by two-sample t-tests (p < 0.01 with Bonferroni correction). Last sub-figure shows the significant association with the symptom scores (p < 0.05 with Bonferroni correction). (B) Statistical analyses result of one FC that showed significant group difference between the SAD group and the other three groups.
