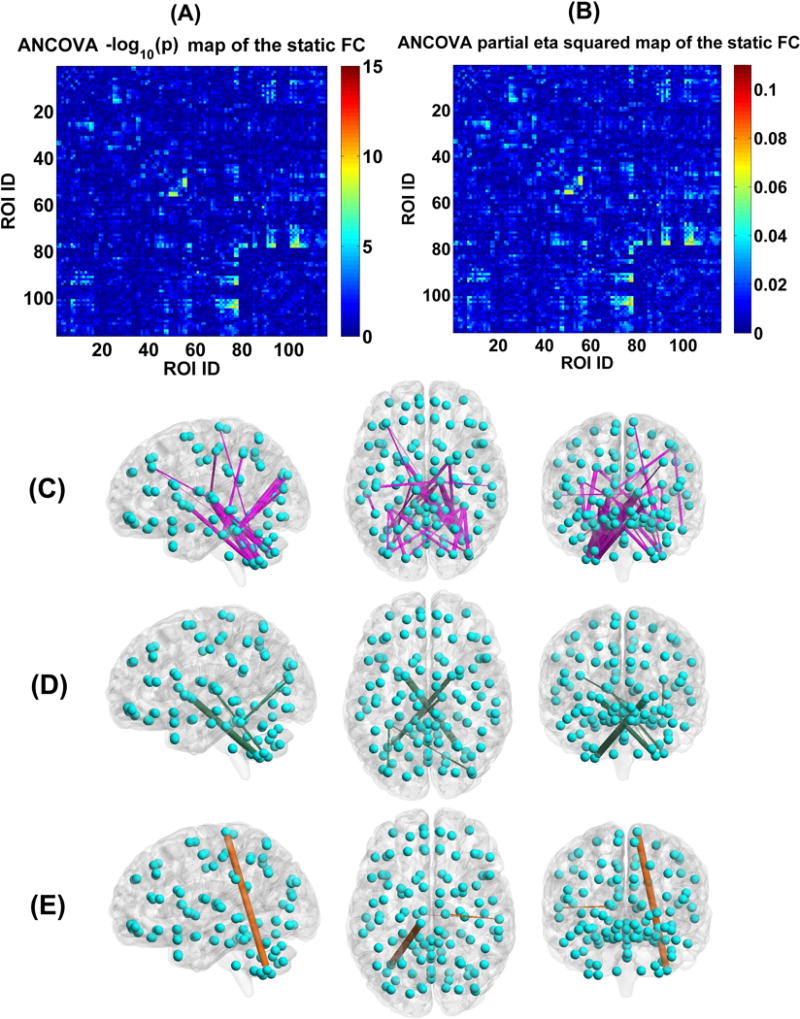
Fig. 15.

(A) Statistical values , which were identified by performing ANCOVA on each FC’s strengths in the static FC matrix of the four groups. (B) Partial eta squared of each FC in the SFC matrix, examined by ANCOVA. (C) The visualization of the 29 discriminative FCs (p < 0.01 with Bonferroni correction). (D) Six FCs that showed decreasing trends from HC to BPP to SAD to SZ using the static connectivity analyses, measured by the mean connectivity strength. (E) Three FCs showing increasing trends across the four groups using the static connectivity analyses, measured by the mean connectivity strength. In (C)-(E), the thickness of each line reflects the associated F-value in ANCOVA.
