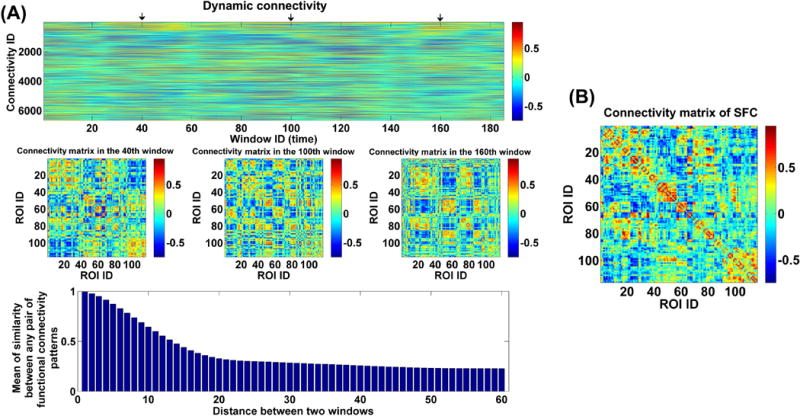
Fig. 2.

(A) The whole-brain dynamic connectivity of one HC from Hartford site. Top panel: The window-direction concatenated dynamic connectivity. Each column represents the connectivity strengths of all ROI pairs at one window, and each row represents the dynamics of connectivity strengths of one pair of ROIs. Middle panel: The connectivity matrices at three time windows marked by arrows in the top panel. Bottom panel: Mean of similarity (measured by correlation) between any two connectivity matrices in two windows with a specific distance. (B) The connectivity matrix from the SFC analyses of the same subject. The x-axis and y-axis in the bottom panel of (A) and (B) denotes the ROI ID, which corresponds to brain regions from the AAL template (see supplementary Table S2).
