
Fig. 4.
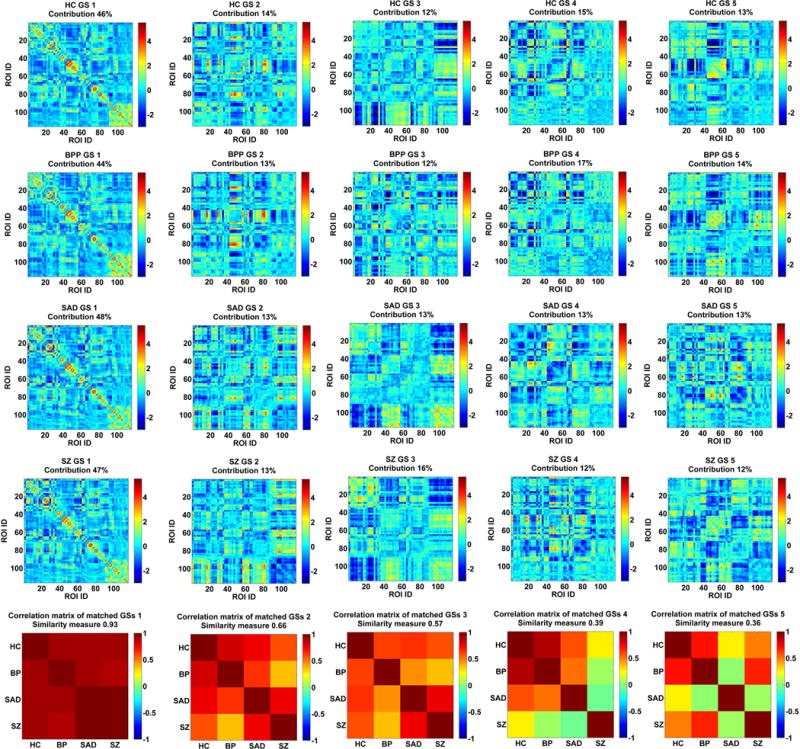
The matched GSs of HC, BPP, SAD and SZ groups and their correlation matrix. Each row of the first four rows includes the connectivity matrices of GSs for one group. Contribution of each GS to dynamic connectivity is shown along with the GS matrix. Each matrix in the last row shows the correlation matrix of the matched GSs from four groups. The similarity measure reflects the mean of those correlations. The first column corresponds to the dominant GS.