
Fig. 5.
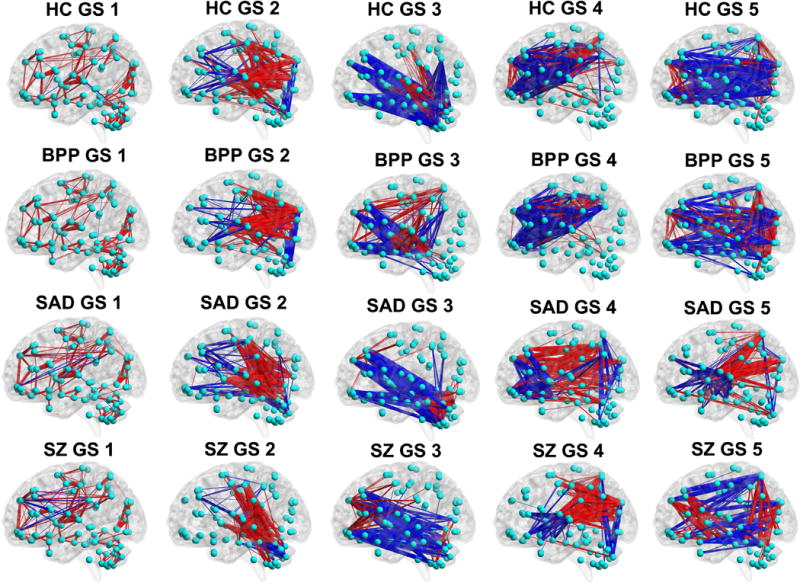
The visualized connectivity patterns of the matched GSs for HC, BPP, SAD and SZ groups. The connectivity patterns are shown using the same sparsity, and the red and blue lines denote positive and negative values in the GS matrix (shown in Fig. 4), respectively.