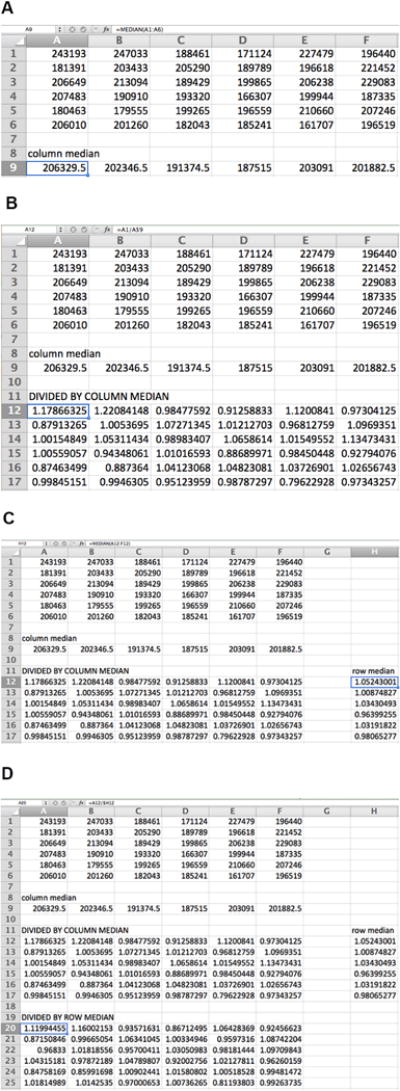
Figure 3. Data normalization by columns and rows for 36-well example plate.

The median of each column is first calculated (A), and each value is then divided by the median of its column (B). The median of each row of transformed data is then calculated (C), and each transformed value is divided by the median of its row (D). The formula for each calculation is shown for the data point in the box.
