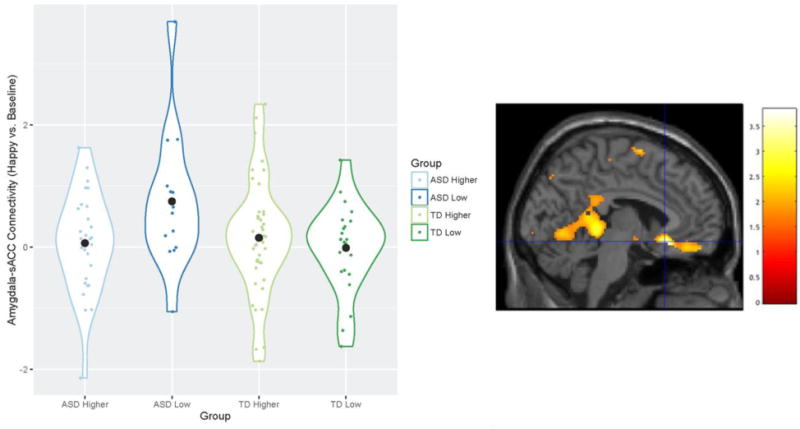
Figure 2.

Differences in left amygdala-sACC (Left BA 25) connectivity across groups contrasting happy versus baseline conditions. Violin plots (meant for visualization purposes only) display the kernel probability density of connectivity values, individual connectivity values, and mean connectivity by group (marked by a black circle-shaped point). Brain image displays area where differences were observed (peak xyz = −4, 22, −12) in Left BA 25 (small-volume corrected), at a voxelwise threshold of .05. The difference in connectivity between the ASD low expressing group and the TD low expressing group remained significant after Bonferroni correction for multiple comparisons. Values for graph were extracted from left BA 25, defined structurally by the Wake Forest University Pickatlas (Maldjian et al. 2003).
