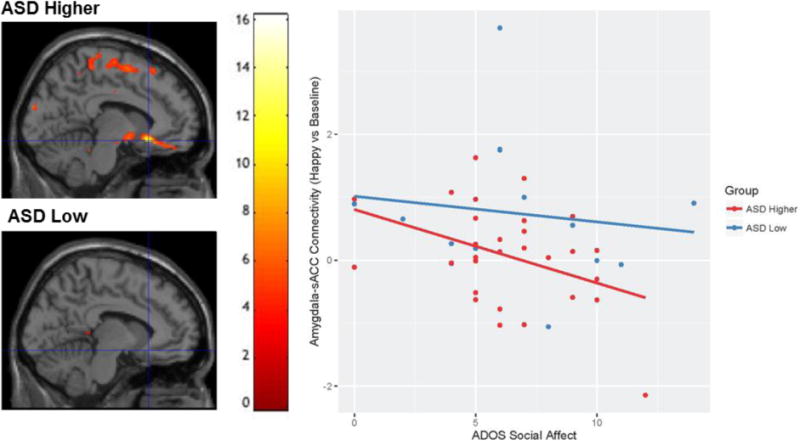
Figure 3.

The relationship between ADOS Social Affect scores and Amygdala – sACC connectivity in ASD low and higher expressing genotypes. Brain images displays area (xyz = −8, 22, −12) where the ADOS Social Affect scores showed a negative relationship with amygdala-sACC connectivity (happy vs. baseline) for individuals with ASD and higher expressing genotypes, but not for individuals with ASD and low expressing genotypes. Scatterplot is used for visualization purposes only. Values for graph were extracted from structural left BA 25, defined structurally by the Wake Forest University Pickatlas (Maldjian et al. 2003).
