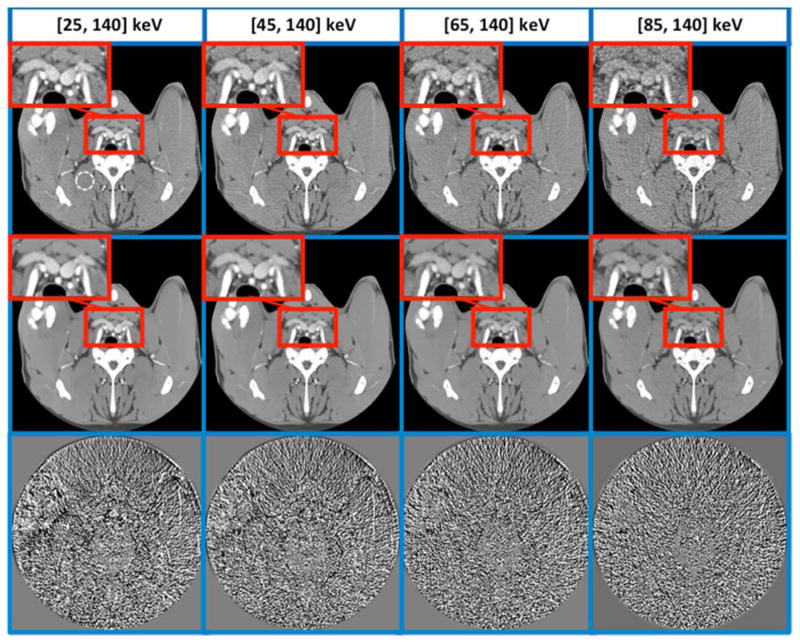
FIG. 11.
MENLM greatly reduces the noise in threshold-based images without affecting subtle anatomical structure and energy resolution. In original FBP images (top row, W/L=400/40 HU), the mean and standard deviation of CT number inside the dotted ROI were 59.6±15.1, 59.9±17.2, 62.2±22.2, and 57.9±32.5, respectively. After MENLM filtering (middle row, W/L=400/40 HU), the values were 59.5±3.4, 59.5±4.3, 61.5±4.6, and 57.7±7.2, respectively. No obvious image structures or signal bias were observed in the difference images (W/L=15/0).

