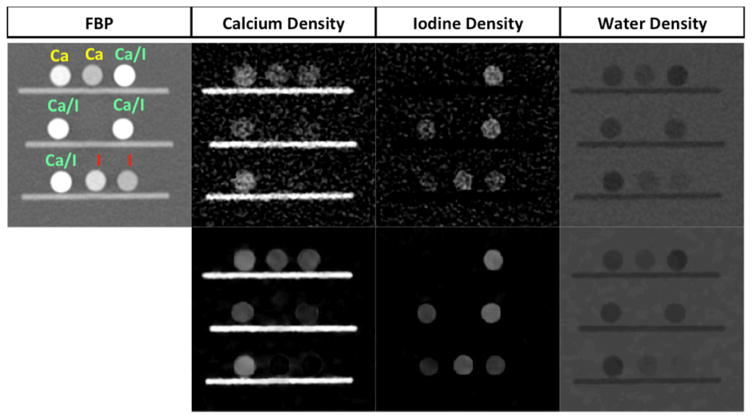
FIG. 9.
The filtered back projection image (FBP) from one energy threshold (25, 140) keV is shown in the left most column. Both calcium (Ca) and iodine (I) were in solution with water. Ca/I stands for vials that included a mixture of calcium, iodine and water. Material specific images (density maps) calculated using material decomposition are shown before (top row) and after MENLM filtering (bottom row). The MENLM algorithm greatly improves the ability to visualize the respective materials and better delineates the edges of the vials containing the various solutions. The unit of pixel value in each image is in mg/ml.

