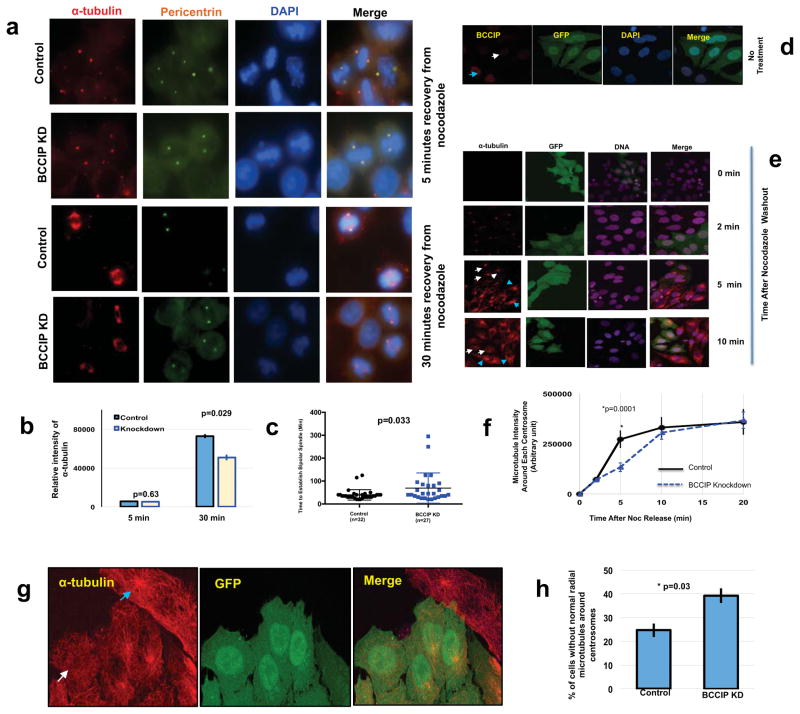
Figure 4. BCCIP loss negatively impacts microtubule retention.
A–C: Recovery of mitotic spindle formation after nocodazole treatment. Control and BCCIP knockdown cells on different slides were treated with nocodozole, washed and allow reformation of spindles. Panels 4A and 4B are the representative image sets and the quantified α-Tubulin intensity at 5 and 30 mins after recovery from nocodazole treatment. Panel 4C is the time used to re-establish bipolar spindle after nocodazole washout are quantified using time-lapse analysis from individual mitotic control or BCCIP knockdown cells.
D–H: Recovery of interphase centrosome microtubule after nocodazole treatment. Control and GFP-labeled BCCIP knockdown cells are mixed and seeded on the same coverslip, immune-fluorescent staining was performed at indicated times after washing off the nocodazole treatment, and the intensity of α-tublin in GFP positive (BCCIP knockdown) and GFP-negative (BCCIP normal) cells were measured and compared. 4D shows the verification of distinguishable BCCIP levels between GFP-negative (control) and GFP-positive (BCCIP knockdown) cells by anti-BCCIP staining in interphase cell. The blue arrowhead indicates a representative GFP-negative control cell expressing normal levels of BCCIP and the white arrow indicates a GFP-positive cell with BCCIP knockdown. 4E are representative images of α-Tubulin intensity in control (GFP negative) and knockdown (GFP positive) cells at indicated times after nocodazole washout and recovery. Blue arrowheads indicate centrosomal α-Tubulin intensity in control cells while white arrows indicate centrosomal α-Tubulin intensity in GFP-positive BCCIP knockdown cells. 4F is the quantified intensity of α-tubulin following recovery from nocodazole. The α-Tubulin signal was quantified in pre-determined area around each centrosome in control and BCCIP knockdown cells and plotted at the indicated time points. 4G are representative images of a control cell (blue arrowhead) that exhibits a well-formed radial microtubule organization, adjacent to a BCCIP knockdown cell (white arrow) that lacks a normal radial microtubule focus. 4H shows the percentages of interphase cells lacking a normal radial microtubule organization (unfocused microtubules) as represented in panel 4G. Depicted is data obtained from 232 control and 259 knockdown cells.

