
Figure 1. Several possible contrasts in real and hypothetic popluations.
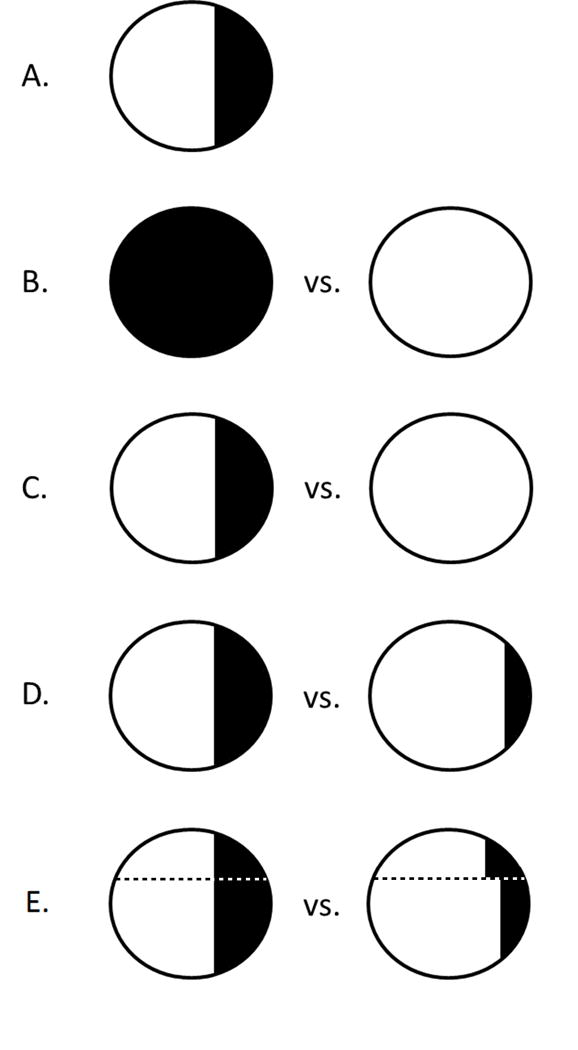
A: an observed population, showing two levels of an exposure as shaded/unshaded. B: population average causal effect, comparing “entirely exposed” and “entirely unexposed.” C: population attributable effect, comparing those observed to be exposed to a population in which no one was exposed. D: generalized intervention effect, comparing those observed to be exposed to a population in which fewer individuals were exposed. E: dynamic intervention effect, comparing those observed to be exposed to a population in which fewer individuals were exposed at different levels with heterogeneity by the value of an additional variable (above and below the dotted line). Broadly we refer to B as an “exposure effect,” and C, D, and E as “population intervention effects.”