
Figure 2.
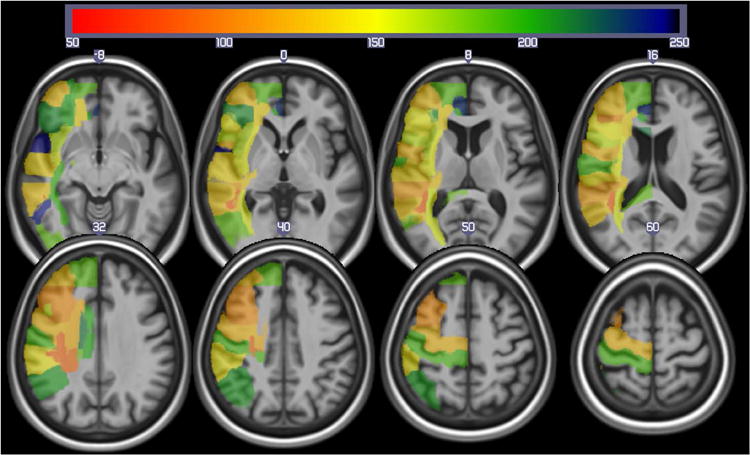
Power map for identifying brain regions (from the JHU atlas) involved with auditory comprehension using lesions (as identified from the DWI scans). The colors reveal the sample size required to exceed z = 3.5 in 60% of the replication studies. This map reveals maximal power in the center of the middle cerebral artery territory.