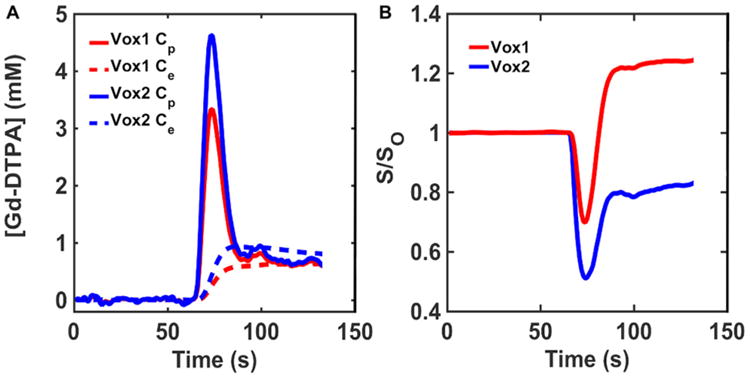
Figure 3.

Representative concentration–time and signal–time curves found in the DRO. Simulated Cp and Ce curves derived using the 2-compartment model for the tissue structures with homogeneous (red) and heterogeneous (blue) ellipsoids illustrated in Figure 2 (A). Corresponding gradient echo signal ratio (S/S0) computed using the finite perturber finite difference method (FPFDM) (B). The tissues consisting of homogeneous and heterogeneous ellipsoids yielded signals exhibiting predominantly T1 and leakage effects, respectively.
