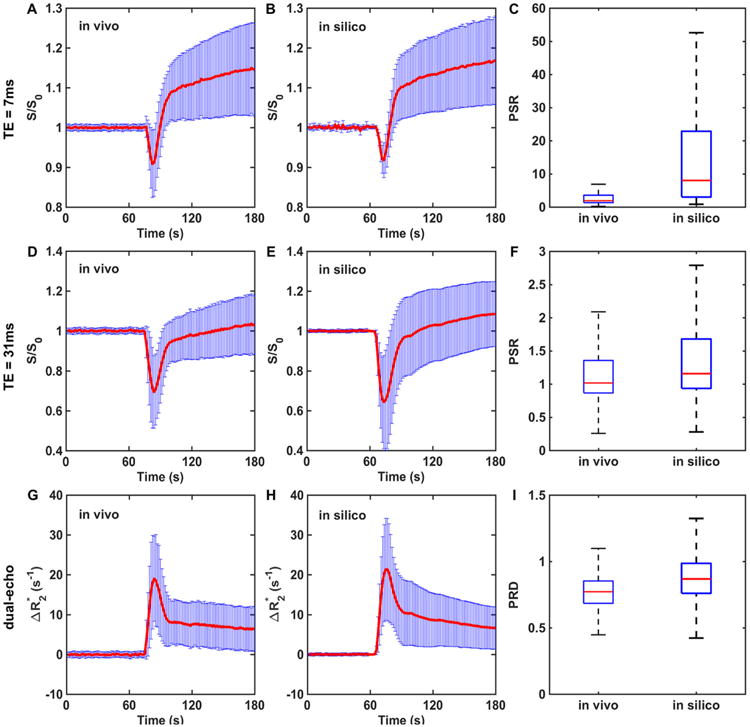
Figure 5.

Validation of the DRO. A correlation analysis identified DRO voxels accurately reflecting the mean and standard deviation of voxel-wise dual-echo dynamic susceptibility contrast-magnetic resonance imaging (DSC-MRI) signals, and the computed dual-echo , in the validation data set. Agreement is seen between the in vivo and simulated signals and PSR values at echo time (TE) = 7 milliseconds (A–C) and TE = 31 milliseconds (D–F), and between the in vivo and simulated dual-echo and the computed PRD values (G–I). The PSR and PRD distributions across all voxels in the in vivo validation data set are a subset of those found in the DRO. These results reflect the broader PSR and PRD heterogeneity exhibited across the much larger number of tumors used to train the DRO compared with that used in the validation data set.
