
Figure 7.
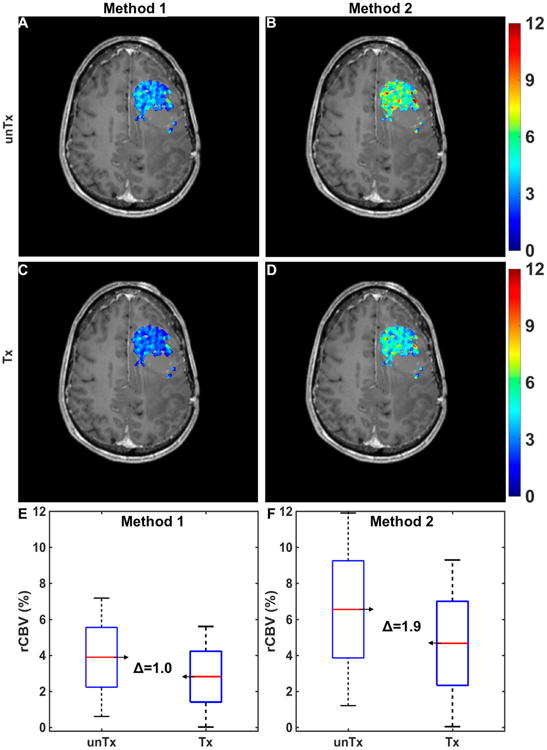
Application of the DRO to optimize DSC-MRI for assessment of treatment response in clinical trials. Simulated pre-(A, B) and post-treatment (C, D) CBV maps in a virtual patient computed using 2 contrast agent (CA) dosing schemes: a single-bolus dose with no preload (method 1; A, C) and a single-dose preload preceding a single-bolus dose (method 2; B, D). Pre-and post-treatment CBV changes within tumor for the 2 methods (E and F). Method 1 yielded a narrower intratumoral range of pre- and post-treatment CBV values but a smaller mean difference compared with method 2.