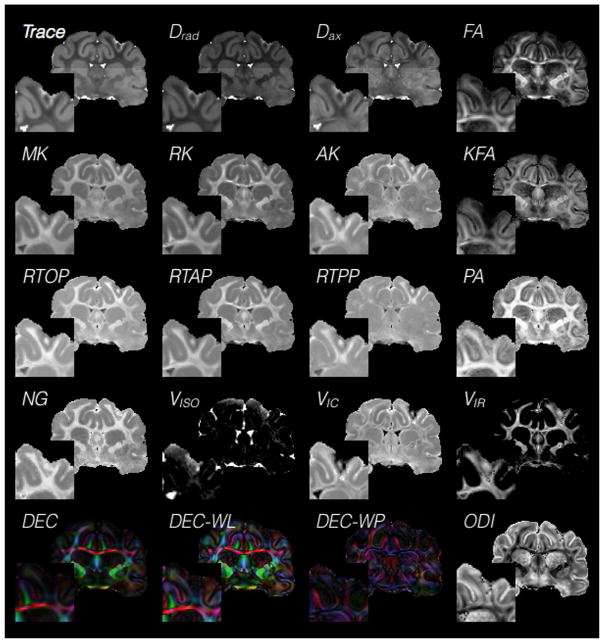
Figure 2.
Cross model comparison of scalar maps in the injured brain. A range of tissue and injury-related contrasts may be visually observed in this collage of 16 representative metrics in the same slice from different dMRI models. This cross-model view of scalar maps demonstrates the potential for non-redundant information about regions of injury that may be gleaned from different models. DTI metrics of Fractional Anisotropy (FA), Trace (TR), Axial and Radial diffusivity (Dax and Drad), directionally encoded color (DEC) map weighted by lattice index, DEC weighted by Westin’s linear anisotropy (WL) and DEC weighted by Westin’s planar anisotropy (WP), DKI metrics of mean kurtosis (MK), Axial and Radial Kurtosis (AK and RK) and Kurtosis FA (KFA), MAP-MRI metrics of return to the origin, axis and plane probabilities (RTOP, RTAP and RTPP), propagator anisotropy (PA) and non-Gaussianity (NG) and NODDI metrics of compartment volume fractions for Isotropic free water (Viso), Intracellular water (Vic) and intracellular restricted water (Vir) and orientation dispersion index (ODI). Insets of each map show tissue near to the injury site where dMRI values are expected to be abnormal.

