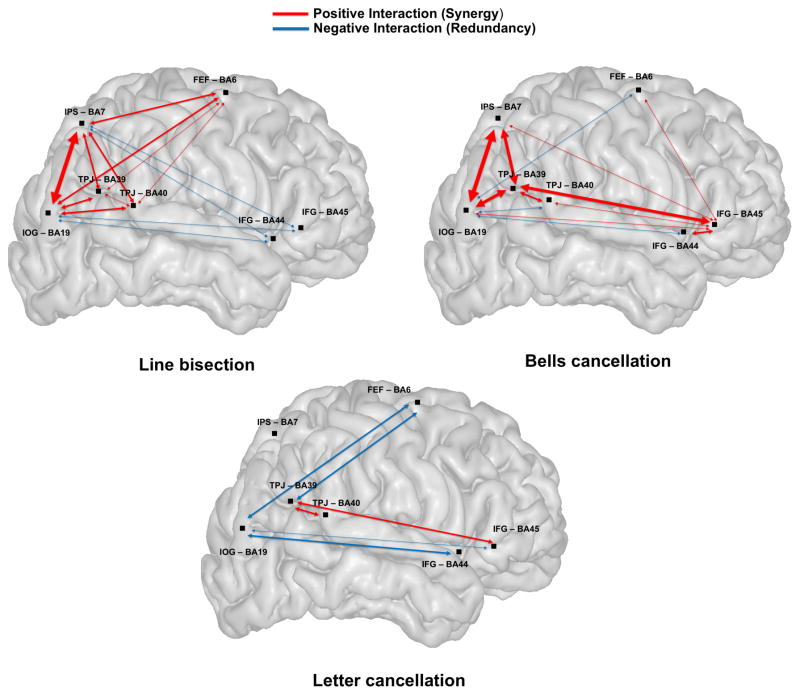
Figure 7. Map of regional functional interactions for the three clinical tests.
Schematic representation of a representative brain volume and functional interactions between pairs of ROIs (BA6/FEF, BA7/IPS, BA19/IOG, BA39/BA40/TPJ, BA44/BA45/IFG) involved in visuo-spatial attention. Positive interactions (Synergy) shown in red arrows indicate that two regions jointly perform better than individually. Negative interactions (Redundancy) shown by blue arrows indicate that two regions have a (partial) functional overlap. The thickness of the arrow between two nodes is proportional to the computed strength of the nodes’ functional interaction. To ensure that the functional overlap indicated by a redundant functional interaction was not primarily caused by lesion pattern covariance, the figure shows only redundancies between regions with independent lesion patterns, (i.e., Pearson correlation coefficients < 0.5 or non-significant coefficients, represented in black, see Figure 3).

