
Figure 5.
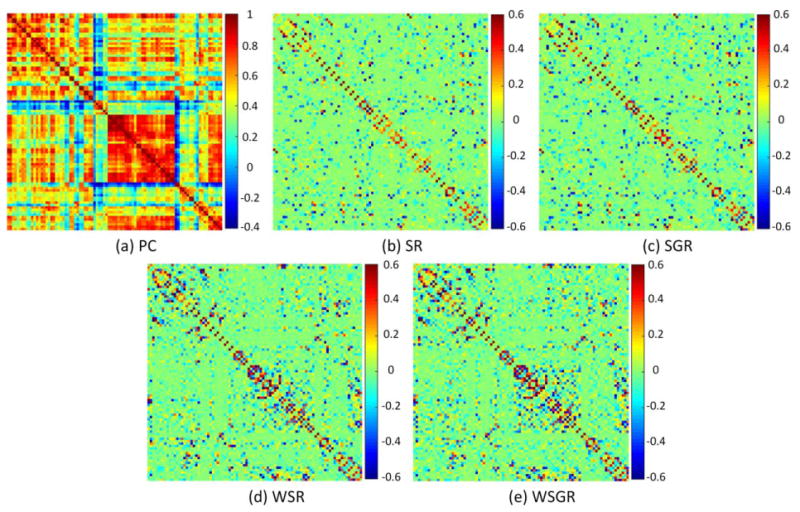
Comparison of brain functional networks of the same subject, reconstructed by five different methods, based on (a) Pearson's correlation (PC), (b) sparse representation (SR), (c) sparse group representation (SGR), (d) weighted sparse representation (WSR), and (e) weighted sparse group representation (WSGR). [Color figure can be viewed at wileyonlinelibrary.com]