Figure 7.

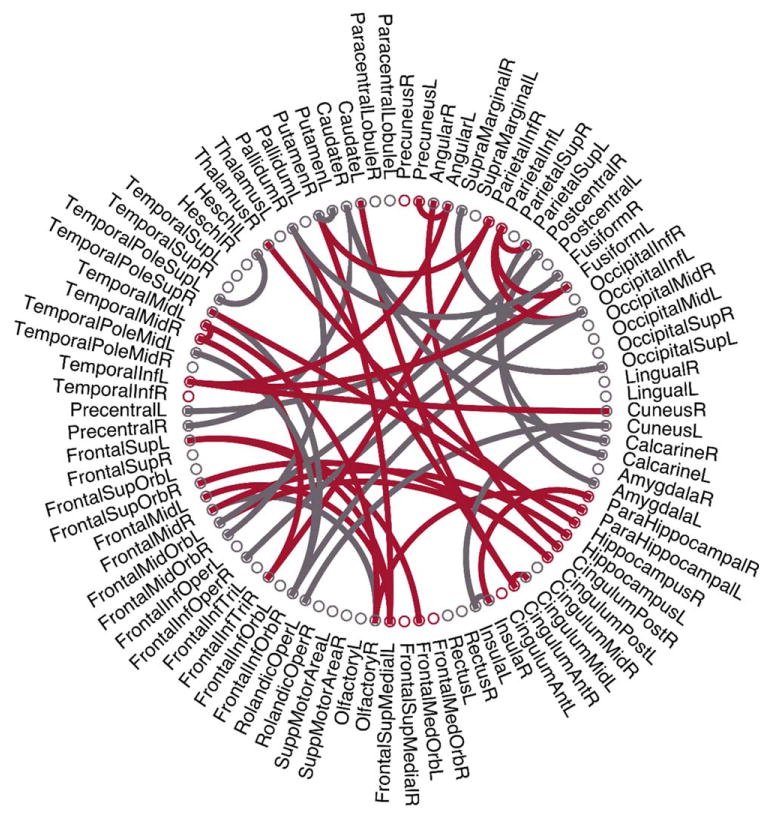
Illustration of 47 consistently selected features (i.e., connections). The red arcs represent the features related to the default mode network. [Color figure can be viewed at wileyonlinelibrary. com]

Illustration of 47 consistently selected features (i.e., connections). The red arcs represent the features related to the default mode network. [Color figure can be viewed at wileyonlinelibrary. com]