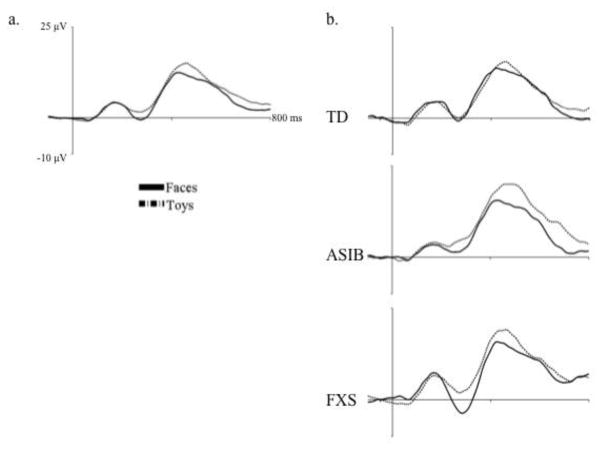
Figure 2.
The N290 in response to faces and toys, (a) across all participant groups and (b) separately for each participant group. In the left figure, the N290 is shown in response to face and toy stimuli averaged across participant groups. The right figure panel presents N290 responses to faces and toys separately for each participant group.

