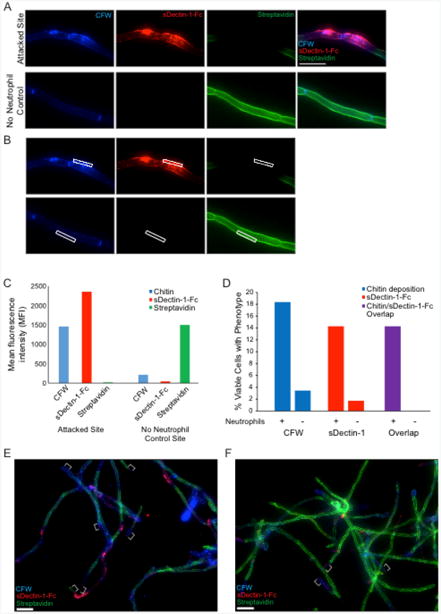
Figure 4. In vitro staining of hyphal cell wall after neutrophil attack.

Representative results for the sDectin-1-Fc staining assay are shown for an attack site and for the no neutrophil control. Panel A illustrates typical staining of both a site attacked by a neutrophil (top) and by the normal unattacked cell wall in a sample of C. albicans hyphae not challenged with neutrophils (bottom). Panel B shows how fluorescence intensity of different labels is measured using a region-of-interest box in Axiovision software to obtain the mean fluorescence intensity (MFI) for each channel. The data comparing fluorescence intensity between a single attack site and a no neutrophil control site are shown in panel C. In addition to quantitative measurement of fluorescence intensities, the percentage of cells displaying a given phenotype (over a number of fields imaged) is also quantified. Panel D shows representative results from quantification of two single fields of view shown in panels E and F. Examples of hyphal tips, which were avoided during analysis, are indicated with white brackets (E-F). More extensive analysis can be seen in Hopke et al., 2016. Scale bar represents 10 μm (A) or 20 μm (E-F).
