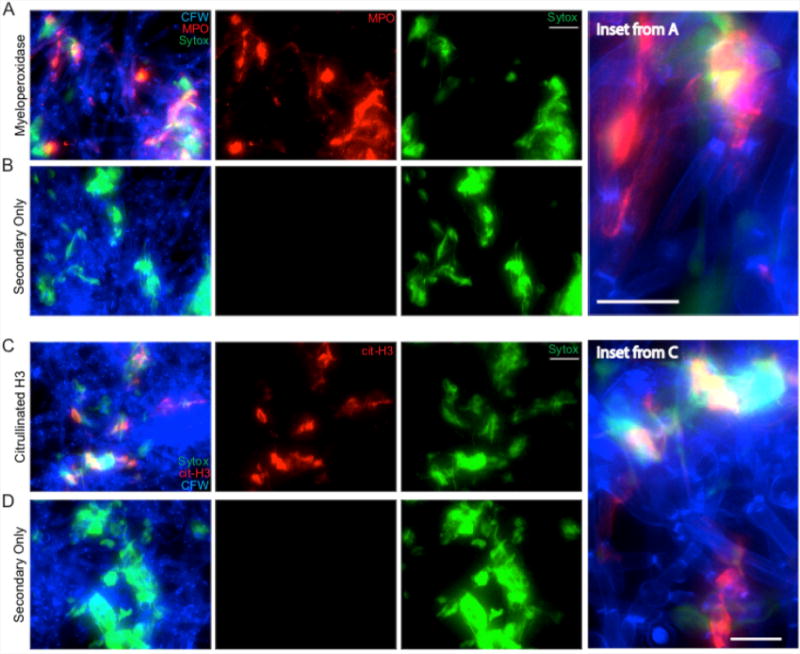
Figure 5. NET staining assay.

Representative results for the NET staining assay are shown for both MPO (A & inset) and citrullinated histone H3 (C & inset). The corresponding secondary antibody only controls are shown below each (B and D). Panels shown include the individual channels for Sytox green staining and either MPO or citrullinated H3 staining as well as the overlay of these channels. Scale bar represents 10 μm (insets) or 20 μm (A-B, C-D).
