
Figure 2.
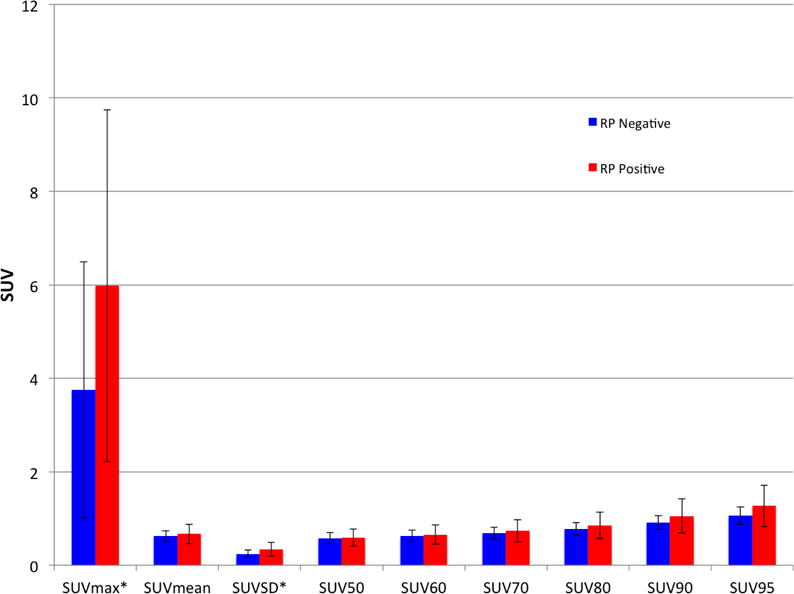
Mean SUV parameter values across patients, separated by RP status. Error bars indicate one standard deviation. Significant differences using Student’s t-test (p < 0.05) among groups are delineated with an asterisk (*).
Official websites use .gov
A
.gov website belongs to an official
government organization in the United States.
Secure .gov websites use HTTPS
A lock (
) or https:// means you've safely
connected to the .gov website. Share sensitive
information only on official, secure websites.
Mean SUV parameter values across patients, separated by RP status. Error bars indicate one standard deviation. Significant differences using Student’s t-test (p < 0.05) among groups are delineated with an asterisk (*).