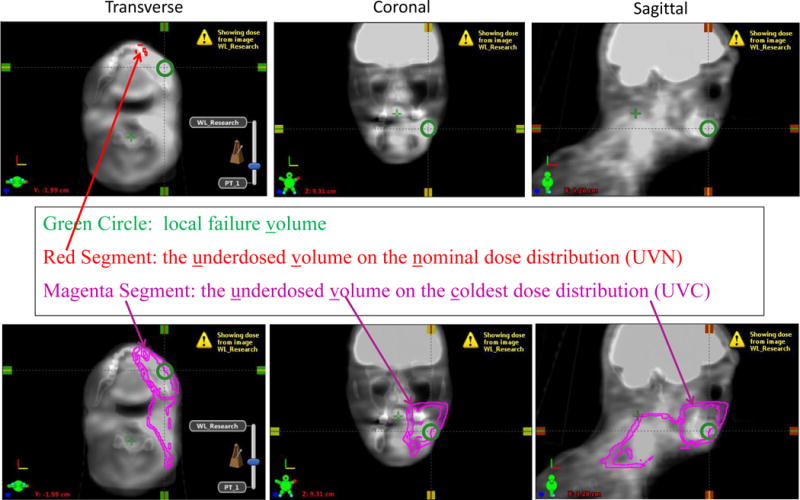
Figure 2.

Illustration of the PET/CT fused with the planning CT for one patient: (a) association between the underdosed volume in the nominal dose distribution (UVN) and local failure; (b) association between the underdosed volume in the coldest dose distribution (UVC) and local failure. The local failure was indicated using green circles, while the underdosed volumes were indicated using magenta lines.
