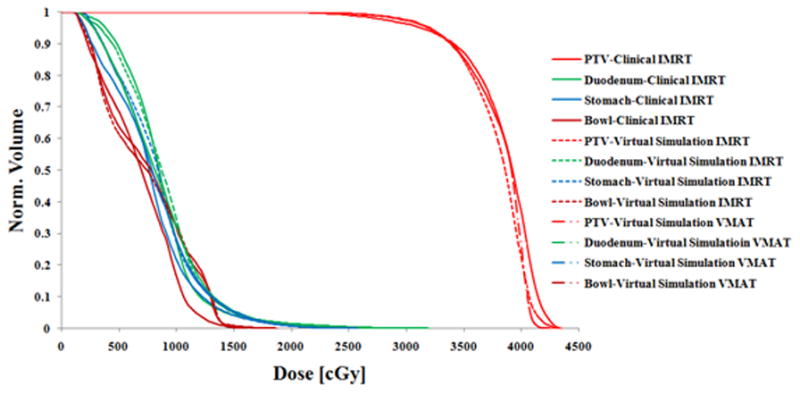
Fig. 10.

Dose-volume histogram (DVH) comparison of the clinically treated IMRT plan (solid lines), virtual simulation IMRT plan (dashed lines) and VMAT plan (dash-double-dot lines) from one patient in this study. The PTV coverage (V33) of clinically treated IMRT plan, virtual simulation IMRT plan, and virtual simulation VMAT plan are 92.9%, 93.3%, and 93.5% respectively.
