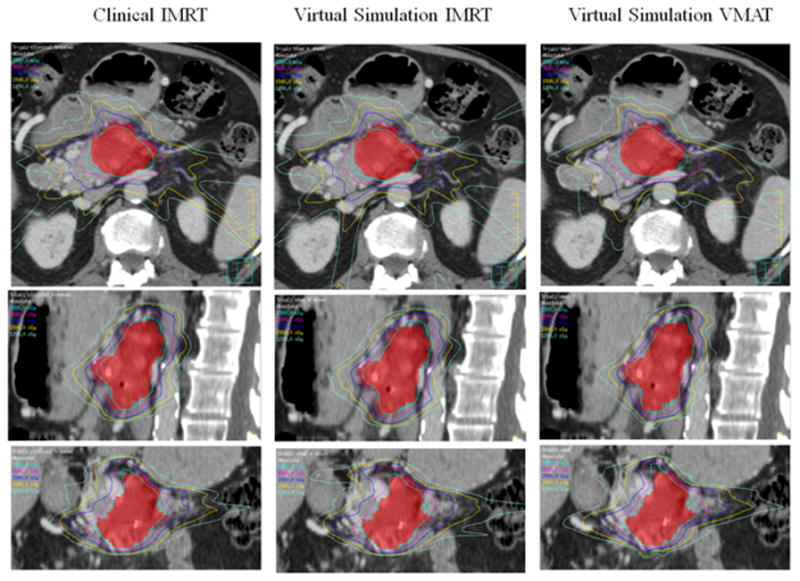
Fig. 9.

The isodose line comparison of different plans from one example patient. The left column shows the clinically treated IMRT plan. The middle column shows the virtual simulation IMRT plan. The right column shows the virtual simulation VMAT plan. The isodose line displayed are 3300 cGy (100% of prescription, in sky blue), 2640cGy (80% of prescription, in purple), 2000cGy (in blue), and 1500cGy (in yellow). The V33 for PTV of clinically treated IMRT plan, virtual simulation IMRT plan, and virtual simulation VMAT plan are 92.9%, 93.3%, and 93.5% respectively.
