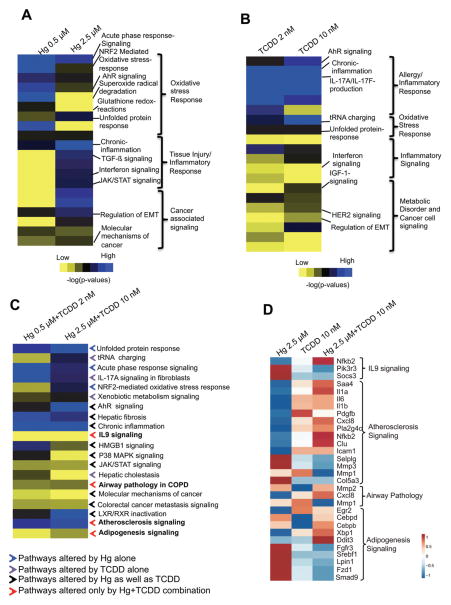
Fig. 3.
Pathway enrichment in BEAS-2B cells exposed to Hg or TCDD individually and in combination. Pathways affected by exposure to low- and high-doses of (A) Hg, (B) TCDD and (C) Hg and TCDD combination. The contribution from each chemical is annotated in (C) as colored arrows. Blue arrows: pathways altered in the cells exposed to Hg alone; purple arrows: pathways altered in the cells exposed to TCDD alone; black arrows: pathways altered in the cells individually exposed to Hg as well as TCDD; red arrows: pathways altered only in the cells co-exposed to Hg and TCDD. IPA comparison analysis was performed on the differentially expressed genes (≥1.5 up- or down-regulation) and the pathways are ranked based on the enrichment score (p < 0.05). The pathways were then annotated/classified based on their function and visualized as a heat map using TreeView 3.3. (D) Heat map showing the expression of genes associated with biological processes uniquely enriched by Hg and TCDD co-exposure. The heat map was generated with ClustVis using a fold change matrix of genes in the exposed cells compared to the corresponding control values.

