Fig. 4.
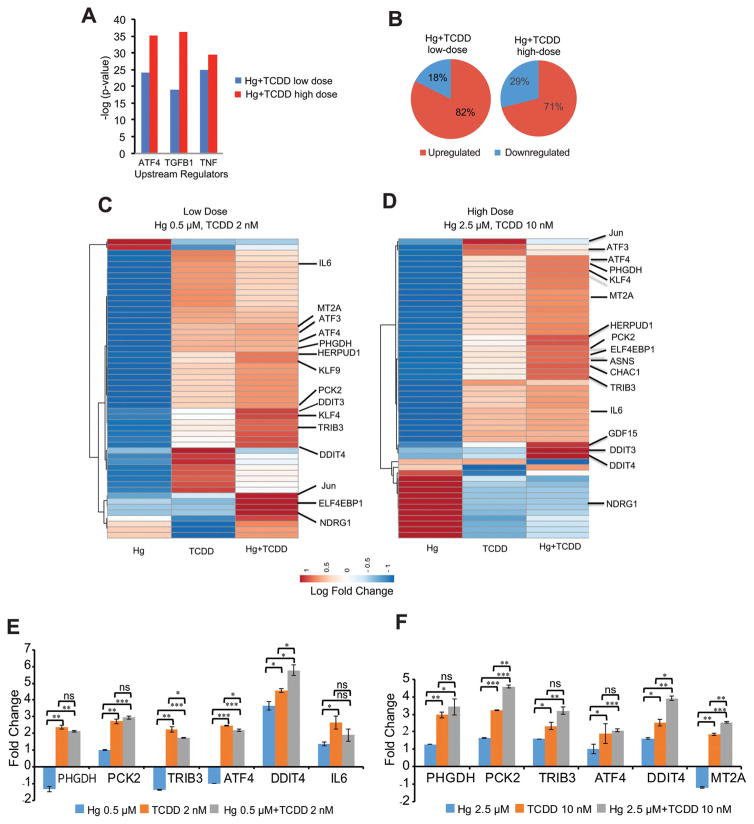
ATF4 is the top upstream regulator activated by Hg and TCDD co-exposure. (A) Top upstream regulators activated by Hg and TCDD co-exposure. Upstream regulator analysis (URA) was performed on the differentially expressed genes, followed by a comparison analysis of upstream regulators between low- and high-dose Hg and TCDD. Fisher’s exact test (p < 0.05) along with the z-scores was used to rank the top upstream regulators. (B) Pie charts showing that higher percentages of genes are upregulated by Hg and TCDD exposure. Unsupervised hierarchical clustering and heat map of the ATF4 target gene fold change following (C) low-dose Hg and TCDD co-exposure and (D) high-dose Hg and TCDD co-exposure. For (C) and (D) heat maps were generated with ClustVis using the log fold change matrix of ATF4 target genes in exposed cells compared to the corresponding control values. (E and F) qPCR validation of RNA-Seq results. mRNA levels of select ATF4 target genes, differentially expressed by low- (E) and high-dose (F) Hg and TCDD exposure shown as fold changes compared to the control. Gapdh was used as an internal control. Error bars represent standard deviations for at least two biological replicates. Statistical significance was evaluated using the t-test (p < 0.05 (*); p < 0.01 (**); p < 0.001 (***)).

