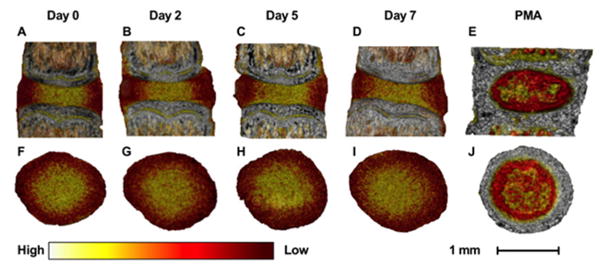
Figure 4. Contrast-enhanced microCT visualization.

Contrast-enhanced microCT can be used to visualize the IVD in three-dimensions during the culture period. Caudal IVDs are shown here. The differential binding of Ioversol to the AF (lower attenuation) and NP (higher attenuation) allows one to distinguish the AF from the NP. Conversely, PMA preferentially binds to the collagen residues in the AF (higher attenuation), the endplates, and the notochord. The images were visualized using color such that white represents high attenuation, yellow represents medium attenuation, and red represents low attenuation. (A-E) Sagittal views of the IVD at days 0, 2, 5, and 7 with Ioversol contrast, and with PMA contrast. (F-J) Transverse views of the IVD at days 0, 2, 5, and 6 with Ioversol contrast, and with PMA contrast. Caudal IVDs are shown here.
