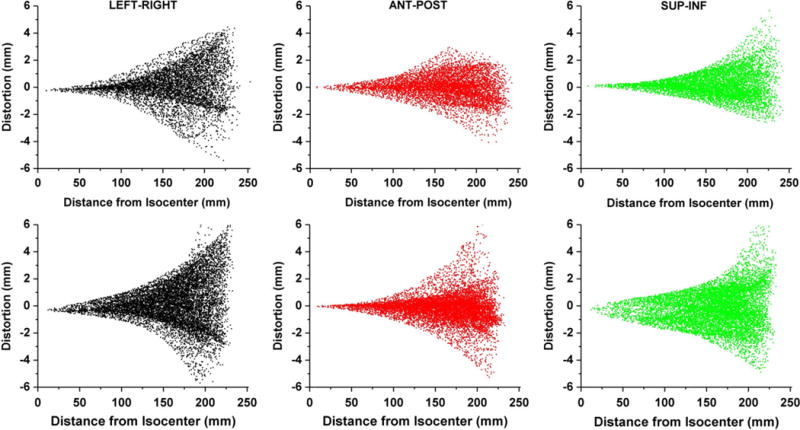
FIG. 4.

(Top Row) Distortion plotted as a function of radial distance from isocenter as generated with previously validated MATLAB software for the left-right (LR), anterior-posterior (AP), and superior-inferior (SI) distortion from left to right, respectively. (Bottom Row) Similar distortion maps as measured with the new phantom and generated with 3D Slicer.
