
FIG. 6.
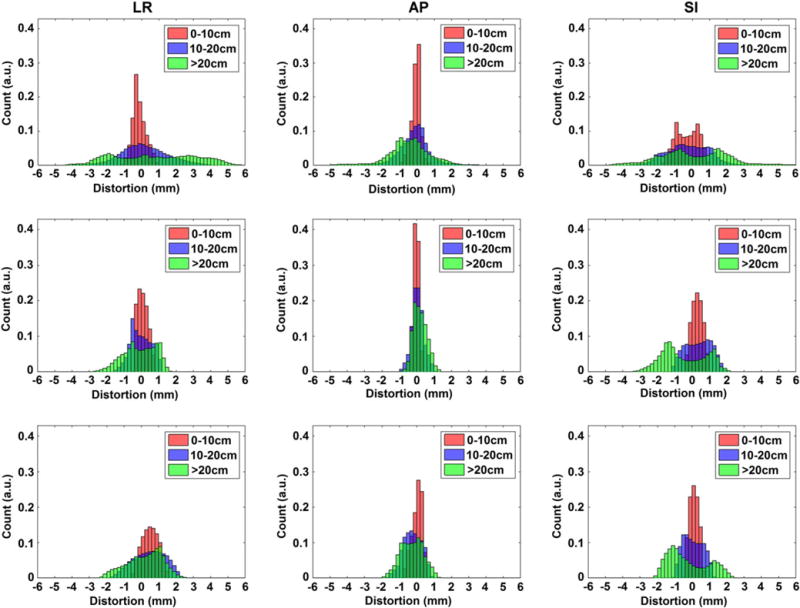
Histograms representing the distributions of distortion measurements for the left-right (LR), anterior-posterior (AP), and superior-inferior (SI) directions using distance to isocenter groupings. Data are shown as follows: (Top Row) 1.0 T Panorama, (Middle Row) 1.5 T Ingenia, and (Bottom Row) 3.0T Ingenia Wide Bore.