
Figure 5. Variance analysis predicts actin and myosin II as regulators of kiss and run exocytosis.
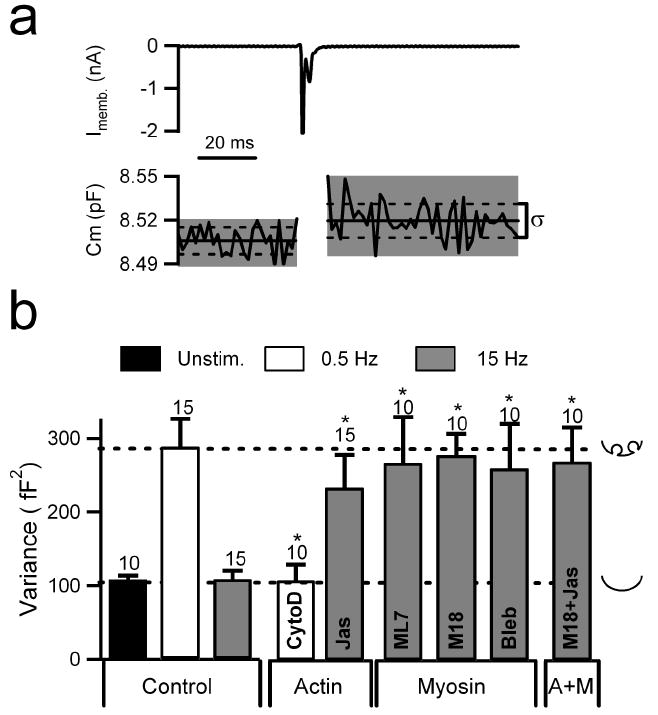
Capacitance variance was utilized to probe the roles of actin and myosin II in regulation of the Ω-figure. (a) Cells held in the perforated-patch configuration were stimulated with 0.5 or 15 Hz APe. Evoked membrane current (top plot) and measured cell capacitance (bottom plot) are shown for an example single APe stimulus. In response to Ca2+ influx, cell capacitance increases by approximately 15 fF, indicating the fusion of 8 or 9 granules with the cell surface. Solid lines indicate linear fits to pre- and post-pulse capacitance. Dotted lines indicate the standard deviation (δ) of these segments and variance (δ2) is calculated after each stimulation. (b) Variance was calculated throughout stimulus trains of APe delivered at 0.5 Hz or 15 Hz in control and cells treated with agents that perturb filamentous actin, MLCK or myosin II function. Concentrations for each agent were as in previous figures. Data are grouped according to pharmacological perturbation. Numbers of cells in each condition are indicated numerically above each category. Statistical significance was determined by Student’s t-test with a significance barrier (p) of 0.05. Error bars represent SEM. Significance with respect to the untreated control group at the same stimulus frequency is indicated as an asterisk. For comparison across conditions, dotted lines are drawn to indicate the control values for 0.5 Hz and 15 Hz stimulation. Icons to the right of the plot indicate the mode of fusion at each control variance level.