
Figure 6. Dextran uptake indicates actin and myosin II regulate fusion pore dilation.
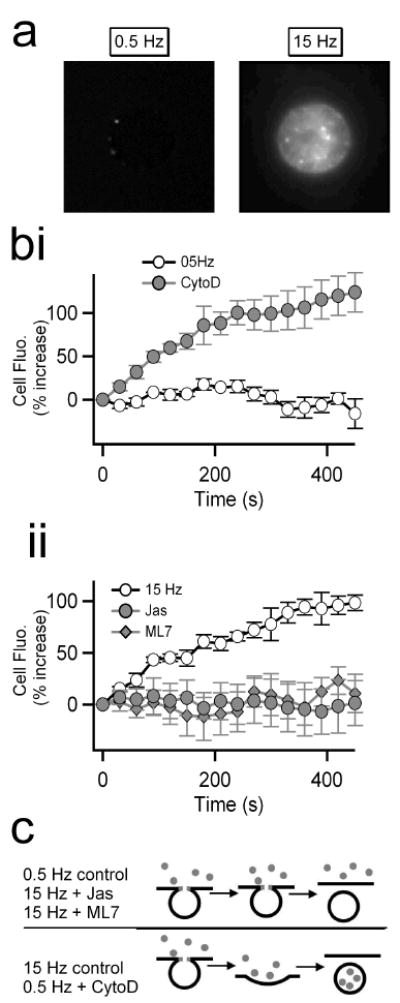
Chromaffin cells were stimulated with 0.5 or 15 Hz action potential waveforms and Texas Red-conjugated fluorescent 70 kD dextran (1 μM) was included in the bath solution as a fluid-phase marker. Cells were imaged during the stimulus train to probe for endosomal marker uptake. (a) Representative images show dye loading for each stimulus condition. (bi) Control cells stimulated at 0.5 Hz showed no 70 kD dextran uptake (n = 8 cells from 4 preparations). Pretreatment with 2 μM cytochalasin D resulted in dextran uptake during stimulation (n = 7 cells from 3 preparations). (bii) Control cells stimulated at 15 Hz showed strong uptake of 70 kD dextran while agents that stabilize actin (Jas) or inhibit MLCK (ML7) each blocked 70 kD dextran uptake (n = [cells/preparations] 8/4; 7/3 and 9/3 respectively). (c) A cartoon representation of the hypothesized modes of exocytosis under different stimulation conditions is pictured. Stimulation at 0.5 Hz or stabilization of F-actin results in kiss and run exocytosis while 15 Hz stimulation or F-actin disruption leads to full collapse.