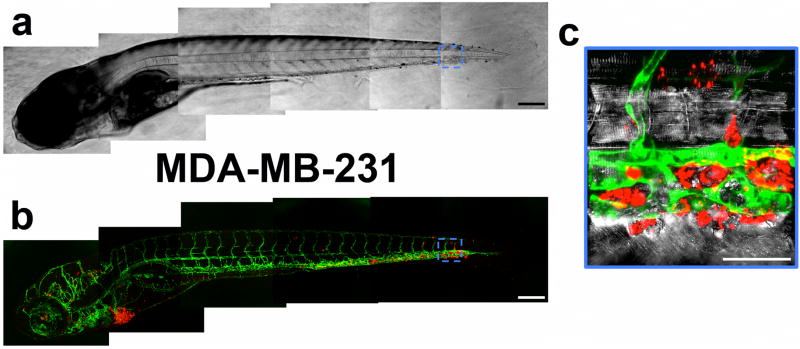
Figure 2. Image mosaic of a zebrafish embryo 4 days after injection with MDA-MB-231 cells.
Brightfield (a) and fluorescent (b) mosaics shown. Fluorescent images are depicted as the maximum projection of a z-stack, in which a green color denotes the vasculature and a red color indicates the cancer cells. Scale bar, 200 μm. (c) The embryo’s caudal region is magnified to show extravasated cancer cells. Punctate fluorescent labeling is seen upon magnification. Scale bar, 50 μm.

