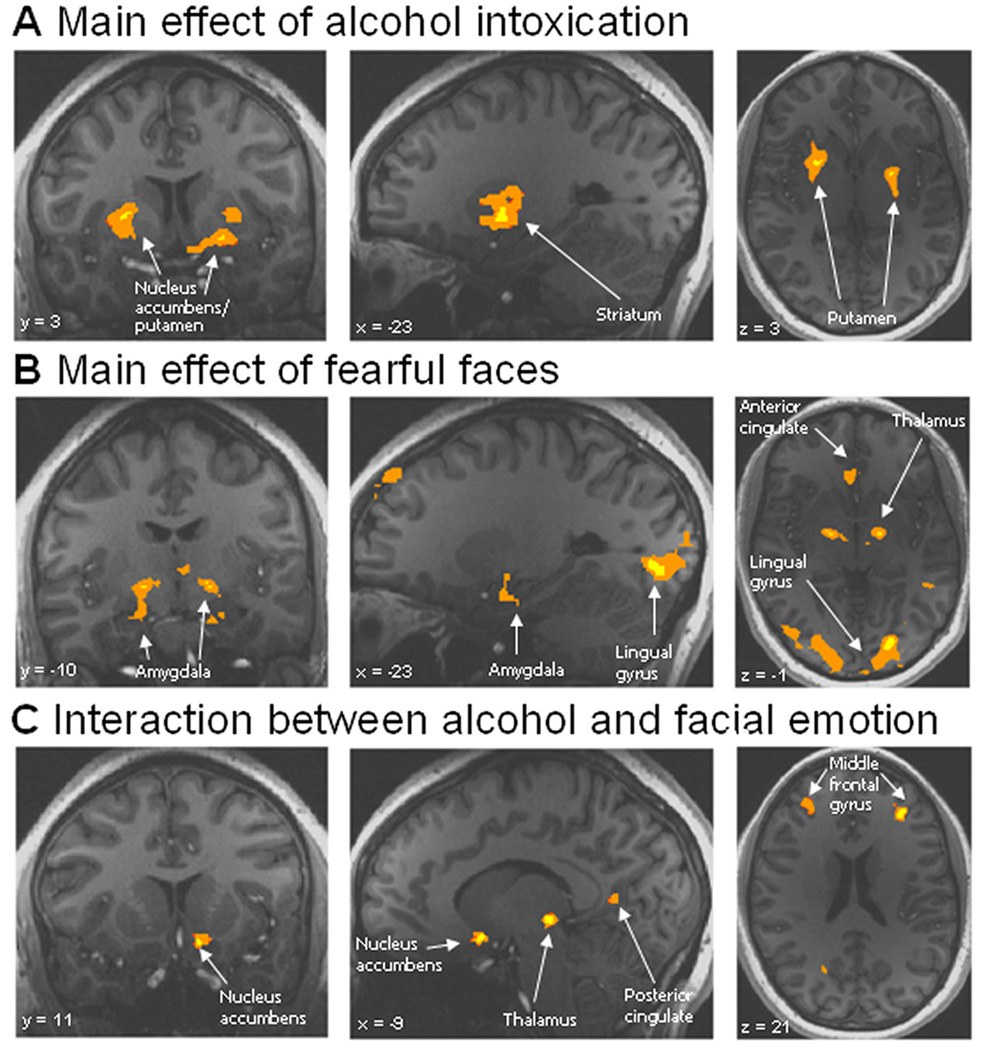
Figure 1.
Main effect of (A) alcohol, (B) fearful facial emotion, and (C) the interaction between them on regional brain activation. Anatomical maps of t statistics were spatially normalized by warping to Talairach space and combined into a group map. Radiological convention is used to display left and right. A statistical map of the main effects of alcohol and facial emotion was computed by performing a voxel-wise ANOVA of the event-related β-coefficients calculated from the general linear model. In this three-factor mixed-model ANOVA, alcohol (alcohol or placebo) and emotion (fearful or neutral) were fixed factors, and subject was a random factor. Alcohol effects were seen primarily in striatal areas, while emotion effects were seen in limbic and visual processing areas. The color map represents the t-score; in orange regions, p < 0.01, and in yellow regions, p < 0.001. See Table 1 for values.

