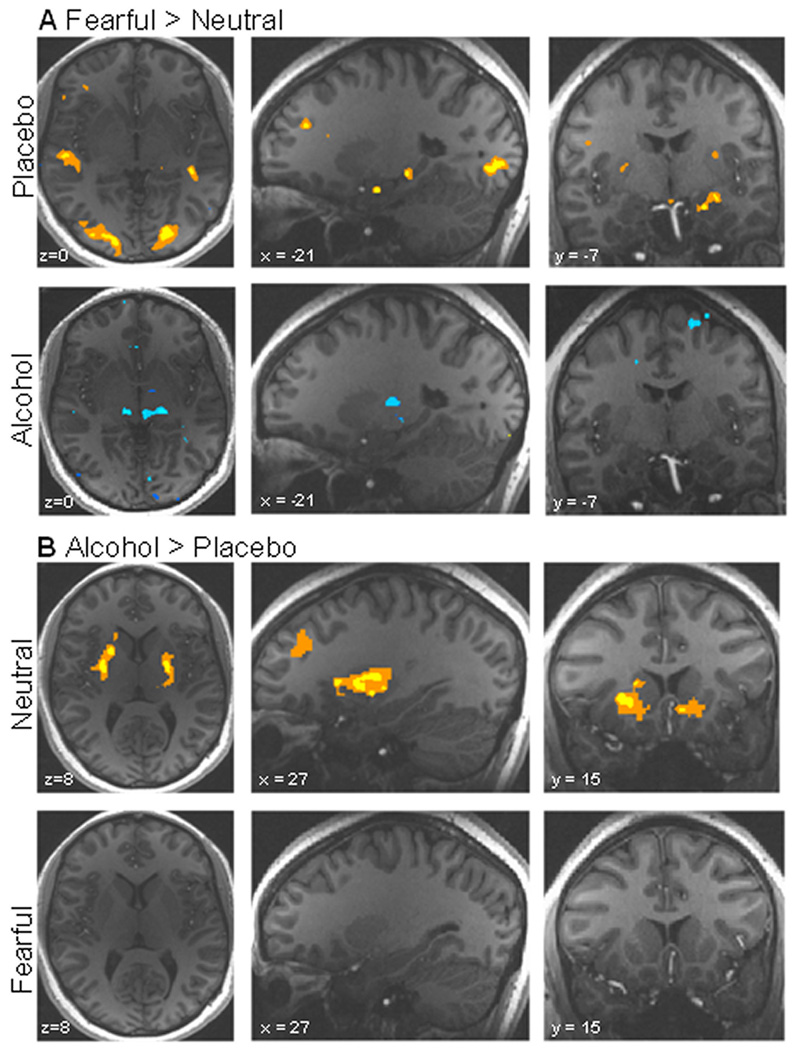
Figure 2.
Linear contrasts between the alcohol and placebo condition under each emotion type (alcohol: fearful > neutral; and placebo: fearful > neutral), as well as linear contrasts between the fearful and neutral conditions separately under the alcohol and placebo conditions (neutral: alcohol > placebo; and fearful: alcohol > placebo). These contrasts were computed by performing voxel-wise t-tests between event-related β-coefficients of each stimulus type. Radiological convention is used to display left and right. (A) Linear contrast between fearful vs. neutral faces in the alcohol and the placebo condition. Increased activation to negative faces is shown in yellow/orange (p < 0.01), while increased activation to neutral faces is shown in blue (p < 0.01). (B) Linear contrast between alcohol and placebo in the fearful and neutral condition. Increased activation to alcohol is shown in yellow/orange (p < 0.01), while increased activation to placebo is shown in blue (p < 0.01). See Table 2 for values.

