
Figure 8. Number of edges significantly related to motion after de-noising.
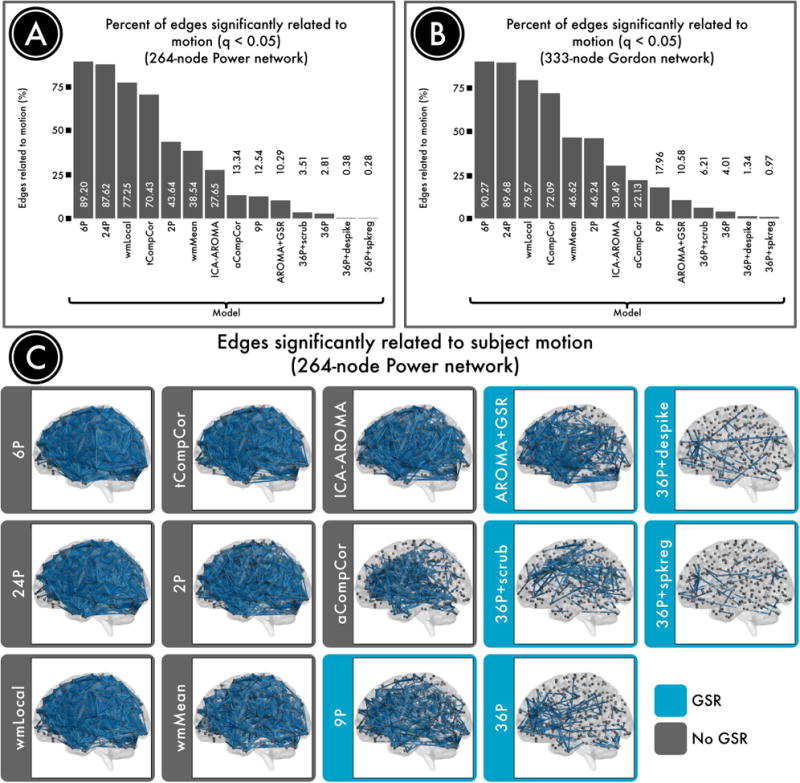
Successful denoising strategies reduced the relationship between connectivity and motion. The number of edges (network connections) for which this relationship persists provides evidence of a pipeline's efficacy. A) The percentage of edges significantly related to motion (FDR Q<0.05) in a 264-node network (Power et al., 2011). Fewer significant edges is indicative of better performance. B) The percentage of edges significantly related to motion (Q<0.05) in a second, 333-node network (Gordon et al., 2014). C) Renderings of significant edges with QC-FC correlations of at least 0.2 for each de-noising strategy, ranked according to efficacy. Strategies that include regression of the mean global signal are framed in blue and consistently ranked as the best performers. Reprinted with permission (Ciric et al., 2017).