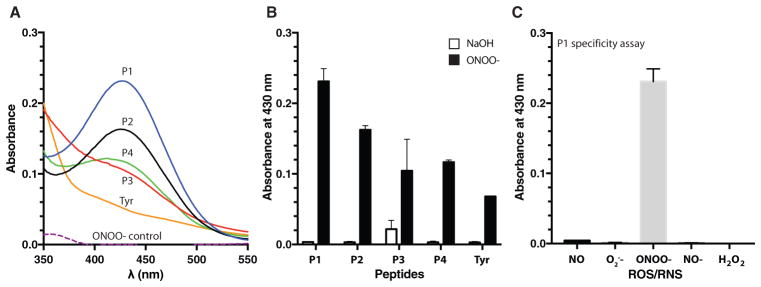
Figure 2.
3-Nitrotyrosine detection with UV–vis spectrophotometry. A) Representative spectra of 3-nitrotyrosine detection for each peptide. Peptides (P1–P4; 1 × 10⁻³ M) and L-tyrosine (Tyr; 1 × 10⁻³ M) were exposed to peroxynitrite (0.5 × 10⁻³ M) in phosphate buffered saline (pH 7.4) for 1 h at 37 °C; nitration yields were determined with UV–vis. The presence of 3-nitrotyrosine in P1 (solid blue line), P2 (solid black line), P3 (solid red line), P4 (solid green line), and Tyr (solid orange line) was shown as an increase in absorbance at 430 nm, where it was compared to peroxynitrite alone (ONOO−; dashed purple line). B) Average 3-nitrotyrosine signal for peroxynitrite-treated peptides (black bars; N = 3) compared to vehicle-treated control peptides (white bars; N = 3). 3-Nitrotyrosine yields were measured at 430 nm using UV–vis spectrophotometry. C) Representative peptide (P1) specificity assay treated with various reactive oxygen and nitrogen species (ROS/RNS; 0.5 × 10⁻³ M). Absorbance values detected at 430 nm (N = 3). Vehicle control = 0.3 M NaOH. Error bars represent SD.

