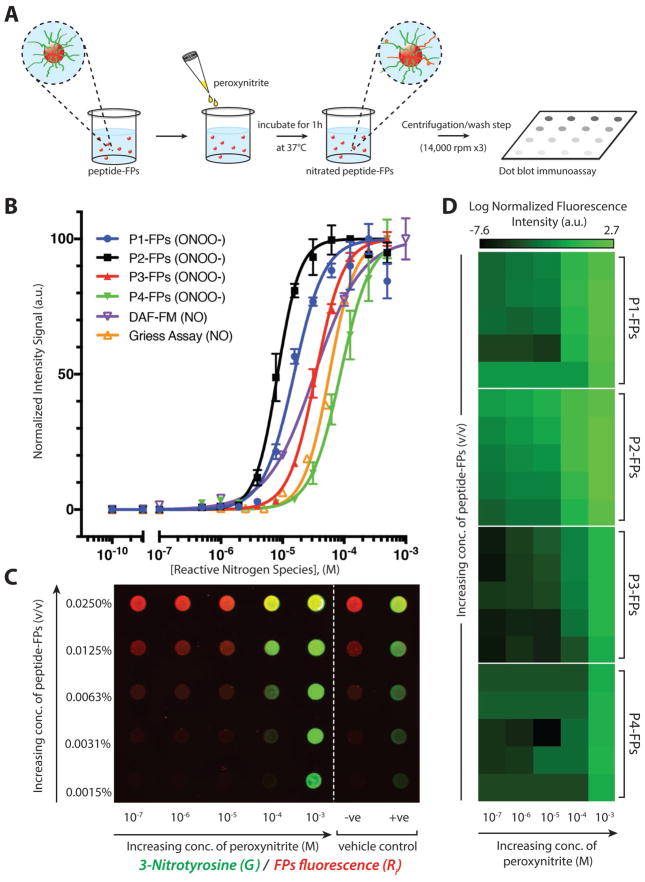
Figure 3.
Representative immunoassay of peroxynitrite-induced nitration of fluorescent particle complexes. A) Schematic representation of peptide–FP complexes treated with peroxynitrite in a 96-well plate and incubated at 37 °C for 1 h, followed by centrifugation/wash step (at 14,000 rpm for 10 min, for three times) and dot blotted onto a nitrocellulose membrane. B) Comparison of normalized dose–response curves of each peptide–FP complex against the DAF-FM probe and Griess assay as a function of increasing concentration of reactive nitrogen species (either NO or ONOO−). Peptide–FPs were treated with peroxynitrite (500 × 10−9 M to 500 × 10−6 M), while the DAF-FM and Griess assay were used to detect NO/NO2−. Peptide–FPs were loaded at 0.01% (v/v) concentration (N = 2). C) Representative immunoarray of 3-nitrotyrosine detection sensitivity as a function of concentration of peptide–FPs or peroxynitrite (representative immunoarray of P1-FPs). Fluorescent particles are shown in red; anti-nitrotyrosine immunofluorescence signal is shown in green; vehicle-treated controls: [sodium hydroxide (0.3 M NaOH; −ve); 3-nitrotyrosine-conjugated fluorescent particles (+ve)]. Fluorescence was detected with a two-channel infra-red scanner (Odyssey; Licor). D) Averaged fluorescence intensity of 3-nitrotyrosine detection as a function of peptide–FPs concentration (y-axis; same concentrations as panel C) or peroxynitrite concentration (x-axis) presented in a heat map (N = 3). Each dot blot fluorescence signal was normalized against the particle’s autofluorescence to account for variations of fluorescent particle concentration. Normalized fluorescence intensity is shown on a log-scale to show the sensitivity of the 3-nitrotyrosine antibody signal.

