Figure 5.
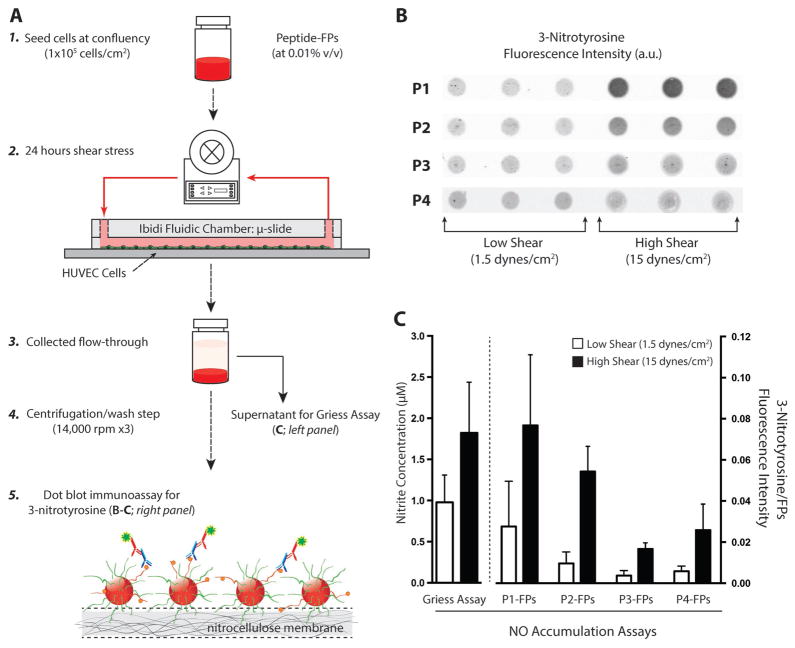
3-Nitrotyrosine detection of cells under shear stress. A) Schematic representation of HUVECs cultured under low and high shear with the presence of circulating peptide–FP complex to detect NO production. Step 1: Cells were seeded at confluency (1 × 10⁵ cells cm−2) and allowed to acclimate overnight (18–24 h). Step 2: Each μ-slide was loaded with peptide–FP complex (at 0.01% v/v) at the start of the shear experiments. Steps 3–4: After 24 h of shear stress, both media and fluorescent particles were collected and pelleted. Step 5: Peptide–FPs were washed and analyzed for 3-nitrotyrosine formation (panel B). The collected medium was stored for nitrite detection (by Griess assay). B) Representative dot-blot immunoassay comparing the amount of 3-nitrotyrosine binding for each peptide–FP complex (P1–P4) under either low or high shear stress. For each peptide–FP complex, six individual experiments were conducted, each with triplicate measures per experimental condition. C) Comparison of NO accumulation assays. (Left) Griess reagent assay detection for nitrite concentration. Nitrite release (24 h – accumulation) was assayed from the supernatant of each sheared experiment. Data show the averaged nitrite release from HUVECs between low versus high shear (N = 22 vs 24; p < 0.01). (Right) Averaged 3-nitrotyrosine signal for each peptide–FP complex normalized against particles autofluorescence to account for loading differences. Data are expressed as mean ± SD for all shear experiments (N = 6) except for P1-FPs and P2-FPs at low shear with only N = 5 each. Error bars represent SD.

