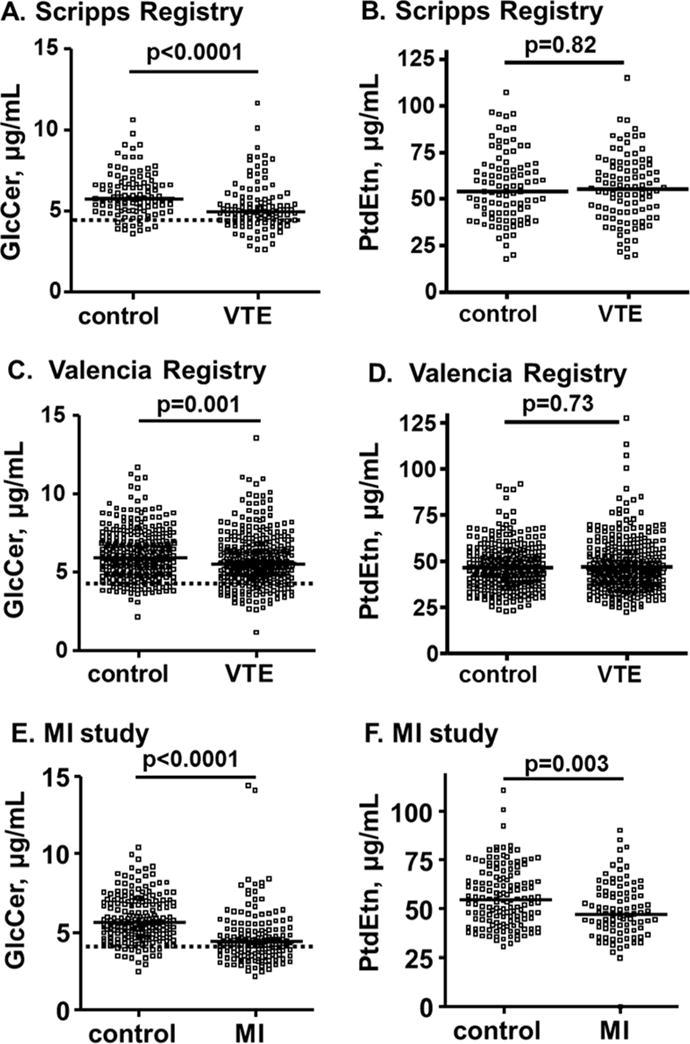
Figure 1. Plasma GlcCer and PtdEtn levels in VTE and MI patients and controls.

Plasma GlcCer and PtdEtn levels were determined for the Scripps VTE registry (A, B), the Valencia VTE registry (C, D), and the MI population (E, F). The solid thick lines indicate median values and the dotted lines indicate the values for the 10th percentile of the controls. The p-values shown are for the difference of median values between VTE patients and controls which was analyzed by Mann-Whitney test using Prism™ 4.03 software (Graph Pad Software Inc., San Diego, CA).
