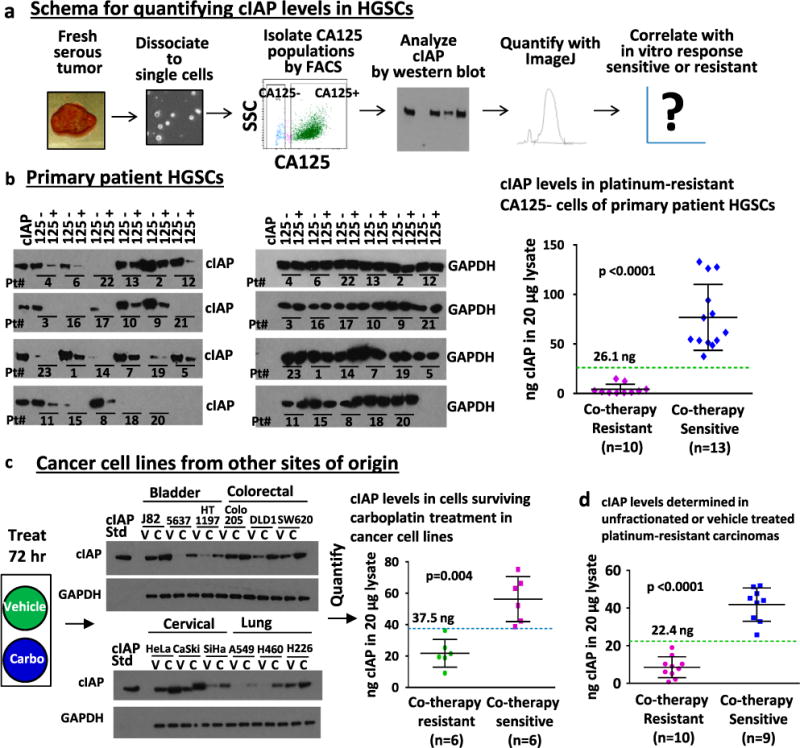
Fig. 3.

Analysis of cIAP levels by western blot effectively segregated co-therapy sensitive vs. resistant HGSCs. a Schema for analysis of cIAP levels in HGSCs by semi-quantitative western blot and its correlation with co-therapy response. b cIAP protein levels were measured in 20 μg of lysate from the CA125 negative and positive HGSC populations and compared with a 40 ng standard of cIAP1 and 2 (20 ng each) included on each blot. Glyceraldehyde 3-phosphate dehydrogenase (GAPDH) was used as a loading control. Levels of cIAP expression, quantified for each sample using ImageJ, were plotted against in vitro response to co-therapy. The expression of cIAP in the CA125 negative cells was significantly higher in co-therapy sensitive (>26.1 ng in 20 μg lysate) compared with co-therapy resistant (<26.1 ng in 20 μg lysate) HGSCs (p < 0.0001). c Levels of cIAP expression were determined in platinum-resistant non-HGSC carcinoma cell lines. Cells were treated for 72 h with vehicle (as control) or carboplatin (to enrich for platinum-resistant cells). Significantly higher cIAP expression was observed after carboplatin treatment in co-therapy sensitive compared with co-therapy resistant cell lines (threshold midpoint 37.5 ng cIAP in 20 μg cell lysate, threshold range 36.3–38.7 ng cIAP, p = 0.004). d Analysis of all platinum-resistant samples (HGSC and non-HGSC) demonstrates that cIAP levels in unfractionated or vehicle-treated tumor cells can segregate co-therapy sensitive (n = 9) vs. co-therapy resistant (n = 10) carcinomas in clinically defined platinum-resistant disease (threshold midpoint 22.4 ng cIAP in 20 μg cell lysate, threshold range 19.1–25.8 ng cIAP, 100% accuracy, p < 0.0001)
