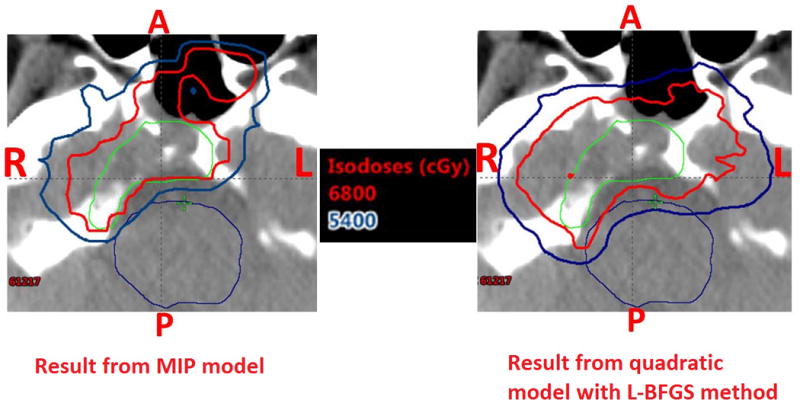
Figure 4.

Dose distribution results at one CT slice for patient 2: MIP model with dose-volume constraints (left) and quadratic model solved by L-BFGS method (right). Green: Clinical target volume (CTV), Cyan: Brain stem. Red: prescription iso-dose line (68 Gy[RBE]), Dark Blue: iso-dose line of 54 Gy[RBE]. MIP model with dose-volume constraints generated a plan with much better brain stem protection at the cost of slight tumor underdosage.
