
FIG. 5.
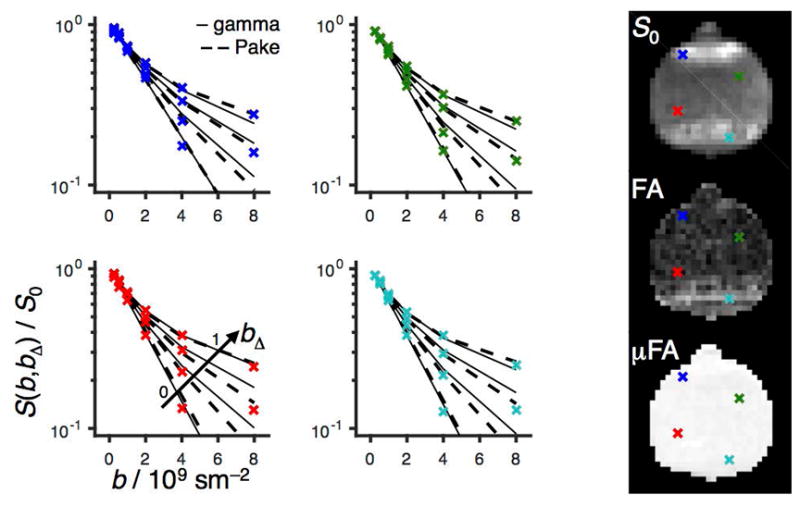
Powder-averaged normalized signal intensity S(b,bΔ)/S0 vs. b for four voxels indicated as blue, green, red, and turquoise crosses on the S0, FA, and μFA parameter maps to the right. Experimental S(b,bΔ) data points are shown as crosses; gamma and Pake model fits are represented by solid and dashed lines for each value of the b-tensor anisotropy bΔ (0, 0.58, 0.82, and 1 from bottom to top as shown with the arrow in the bottom left panel).