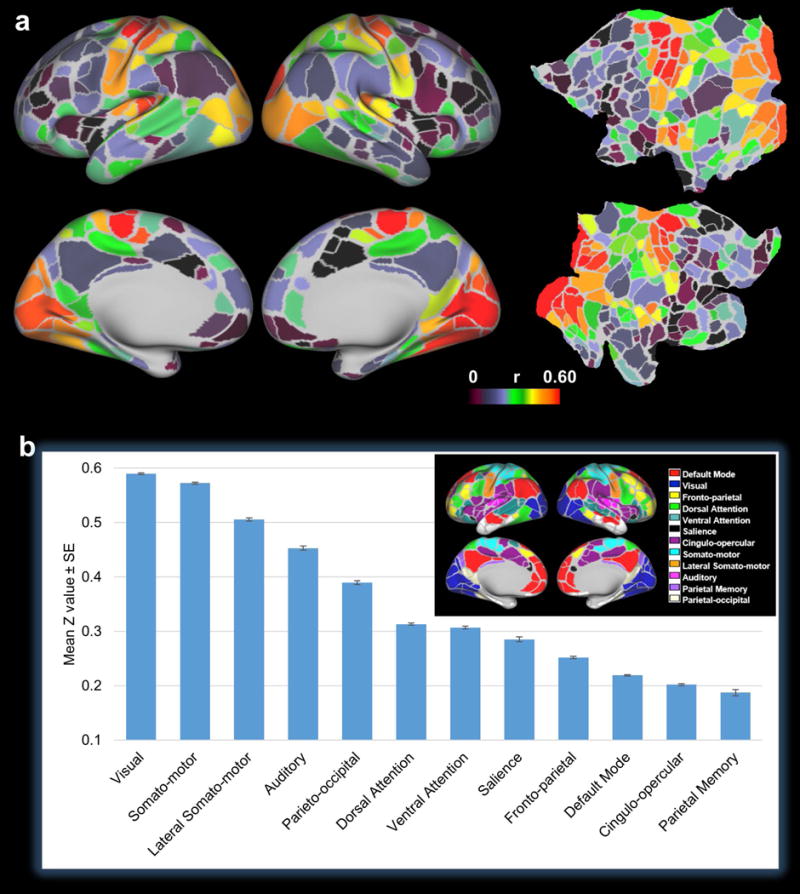
Figure 6.

a, Parcel-wise mean correlation map displayed on inflated and flattened surfaces. The myelination covariance-RSFC correlation values of all grayordinates within each parcel (Gordon, et al., 2016) were averaged and the mean correlation values were displayed for all parcels in the map. b, Mean correlation values averaged across all grayordinates within each RSN. The parcellation scheme and network definition are shown in the inset (Gordon, et al., 2016).
