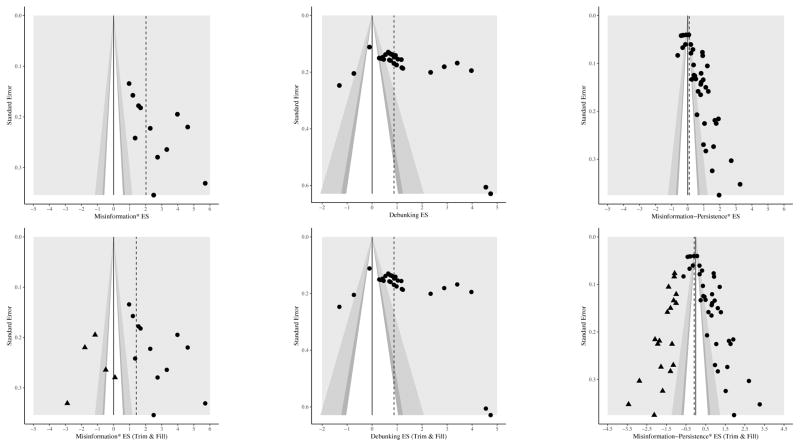
Figure 2.
Contour-enhanced funnel plots of effect sizes (x-axes) (top panel). Contour-enhanced funnel plots with “filled” records (triangles) (bottom panel) using fixed-effects models. The vertical dashed lines indicate the mean estimates of the fixed-effects model. An asterisk refers to the removal of outliers for misinformation and misinformation-persistence effects.

