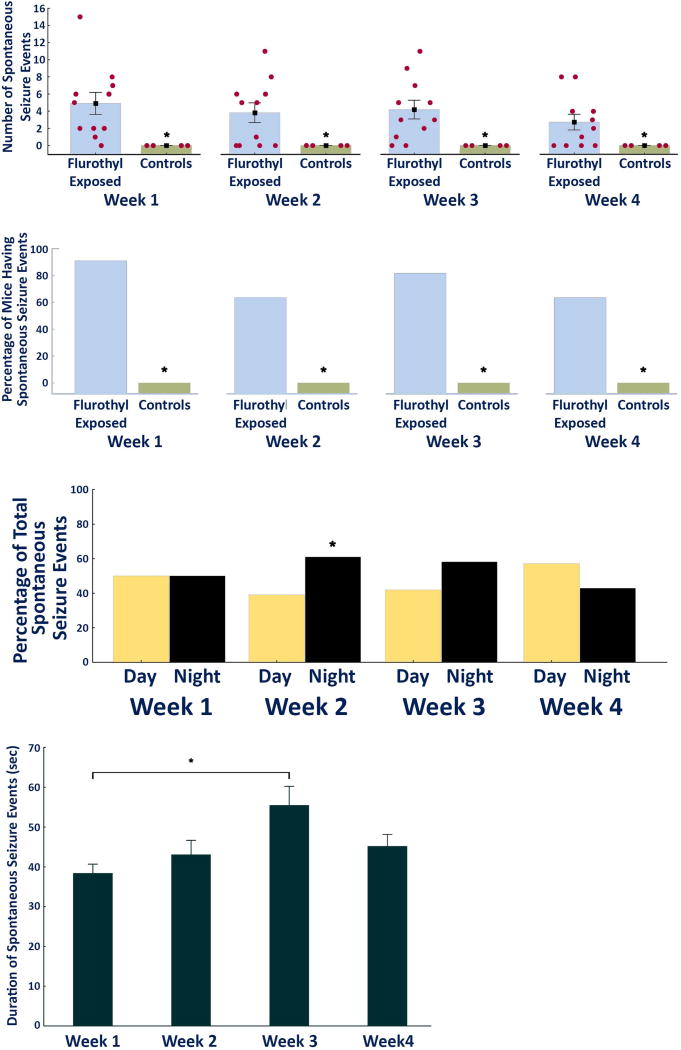
Figure 3.
Characteristics of the spontaneous seizures recorded during a four week long video-EEG recording period in DBA2/J mice following exposure to repeated flurothyl-induced seizures. (A) Average and total number of spontaneous seizures that occurred during the four week recording period in DBA/2J mice exposed to flurothyl as compared to controls grouped according to weeks. Significant differences exist between flurothyl exposed and control mice (week 1: p < 0.004; week 2: p < 0.009; week 3: p < 0.004; week 4: p < 0.02). The x-axis represents the duration of the recording period in weeks, whereas the y-axis represents both the average and SEM, and individual number of seizures expressed by the DBA2/J mice exposed to flurothyl (red circles). (B) Percentage of DBA/2J mice expressing spontaneous seizures during the four week recording period binned by weeks. Significant differences were observed between flurothyl exposed and control mice (Fisher Exact tests: week 1: p < 0.004; week 2: p=0.05; week 3: p < 0.02; week 4: p=0.05). (C) Circadian pattern of seizure distribution in DBA/2J mice during the four week recording period grouped by weeks. Significant differences exist between day and night only during week two of the recording period (p < 0.05). 7AM to 7PM represents day (the animals’ normal sleep cycle) during which the lights are turned on in the animal facility. (D) Average duration of spontaneous seizures in DBA/2J mice across the four week recording period. The duration of these seizure events were significantly different only between weeks one and three of the recording period (p < 0.002).

